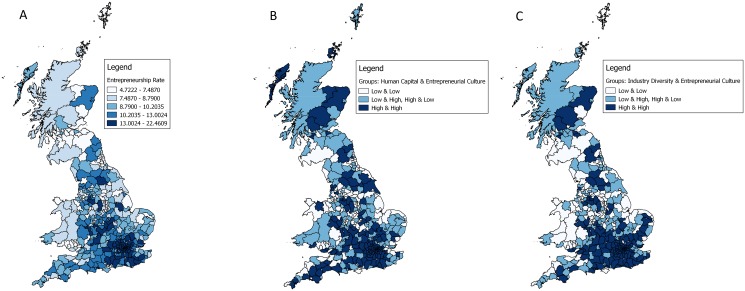
Fig 4. Maps of entrepreneurship rates and the interaction between human capital, industry diversity, and entrepreneurial culture of GB regions (N = 375).
(A) Fig 4A (left): Entrepreneurship rate in GB regions. (B) Fig 4B (middle): Interaction groups between human capital and entrepreneurial culture in GB regions. (C) Fig 4C (right): Interaction groups between industry diversity and entrepreneurial culture in GB regions. Fig 4B should be interpreted as follows: Both variables, human capital and the entrepreneurial culture were splitted at the median. Regions in bright have below median values in human capital and the entrepreneurial culture. Regions in light blue are above median in either human capital or the entrepreneurial culture. Regions in dark blue have above the median values in human capital and entrepreneurial culture. Fig 4C is interpreted in the same way as Fig 4B while interaction groups are created for the variables industry diversity and entrepreneurial culture. The shapefile underlying these maps was kindly provided ONS Geography. It contains Ordnance Survey data: Crown copyright and database right 2015.

