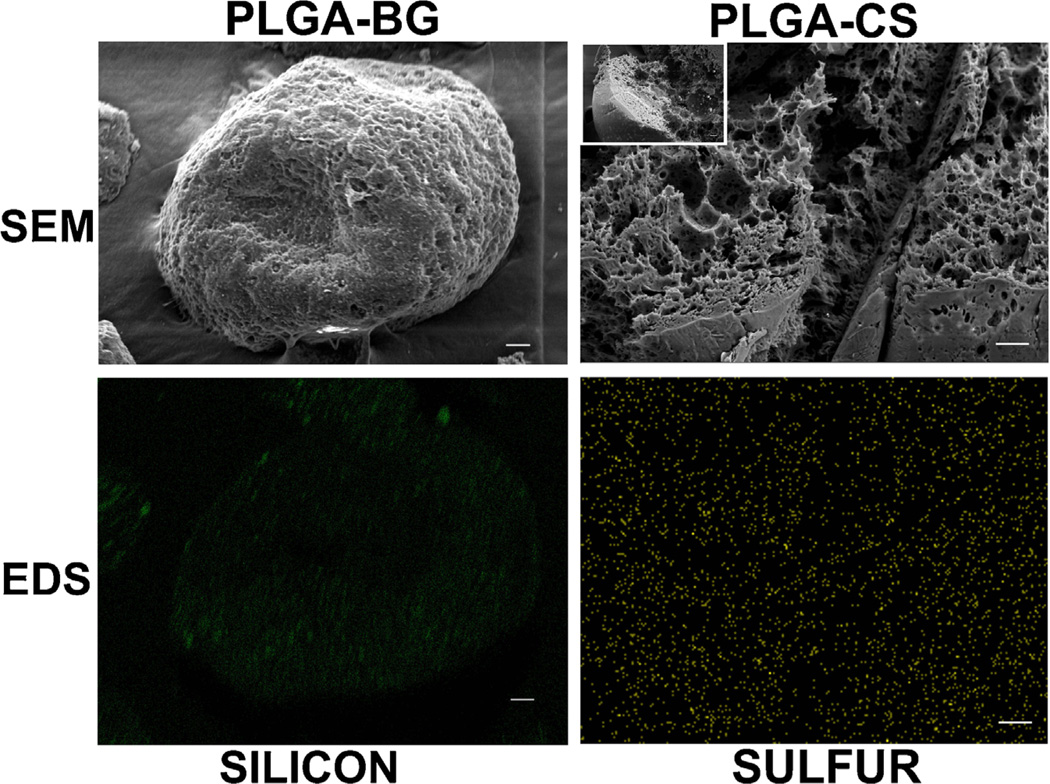
Figure 2.
Scanning electron micrographs (SEM) and energy dispersive system (EDS) mapping of microspheres prior to sintering showing the distribution of BG in PLGA-BG and CS in PLGA-CS. The left panels indicate SEM of the surface of a PLGA-BG microsphere and EDS mapping for silicon (green color) to identify the distribution of BG nanoparticles on the surface of the microsphere. Similarly, the right panels correspond to SEM and EDS mapping for sulfur (yellow color) in the cross section of a cryofractured PLGA-CS microsphere. Distribution of BG and CS were nearly—but not perfectly—homogeneous. Scale bars: 20 µm. PLGA-CS poly(d,l-lactic-co-glycolic acid-chondroitin sulfate), PLGA-BG poly(d,l-lactic-co-glycolic acid-bioactive glass), CS (chondroitin sulfate) and BG (bioactive glass).

