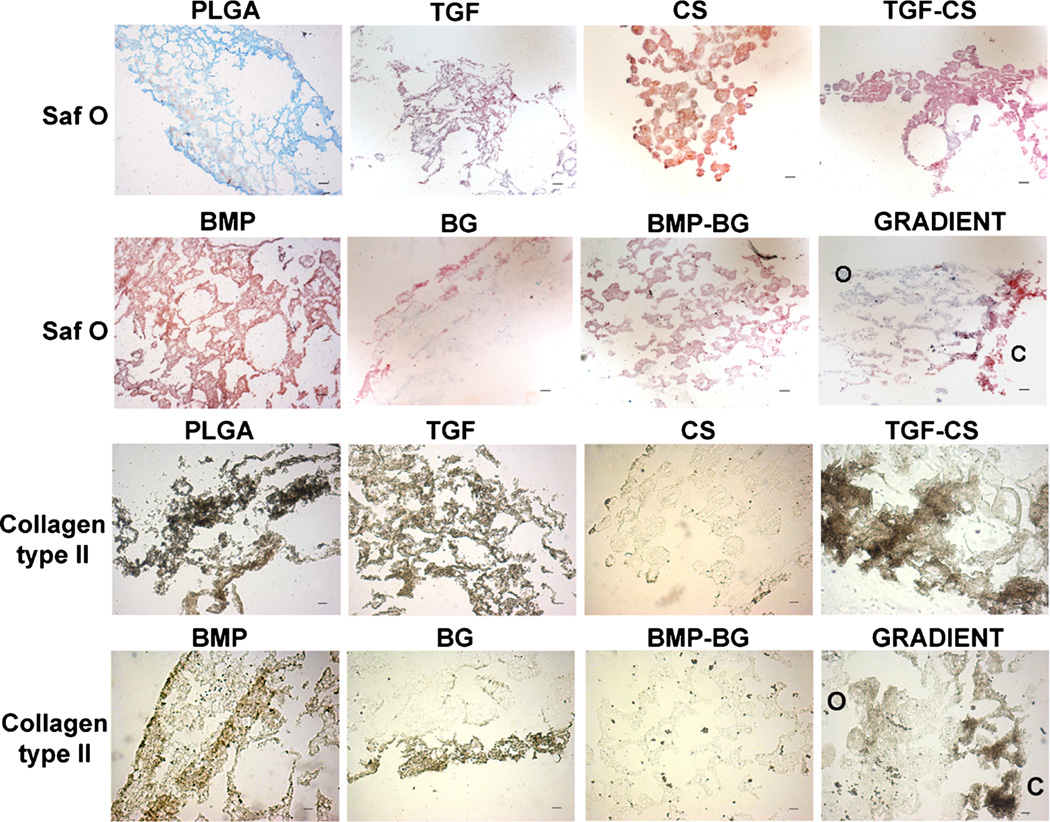
Figure 7.
Representative images for histological analysis of constructs at week 6. The CS encapsulated groups showed deeper staining for Safranin O. The immunostaining intensity for collagen type II was greater in the TGF group. The gradient scaffolds showed more intense staining for GAG and collagen type II in the chondrogenic region. C and O represent the locations of the chondrogenic and osteogenic sides on the sections of gradient scaffolds. Scale bar: 100 µm. PLGA poly(d,l-lactic-co-glycolic acid), TGF (transforming growth factor-β3), CS (chondroitin sulfate), TGF-CS (transforming growth factor-chondroitin sulfate), BMP (bone morphogenic protein-2), BG (bioactive glass), and BMP-BG (bone morphogenic protein-bioactive glass).

