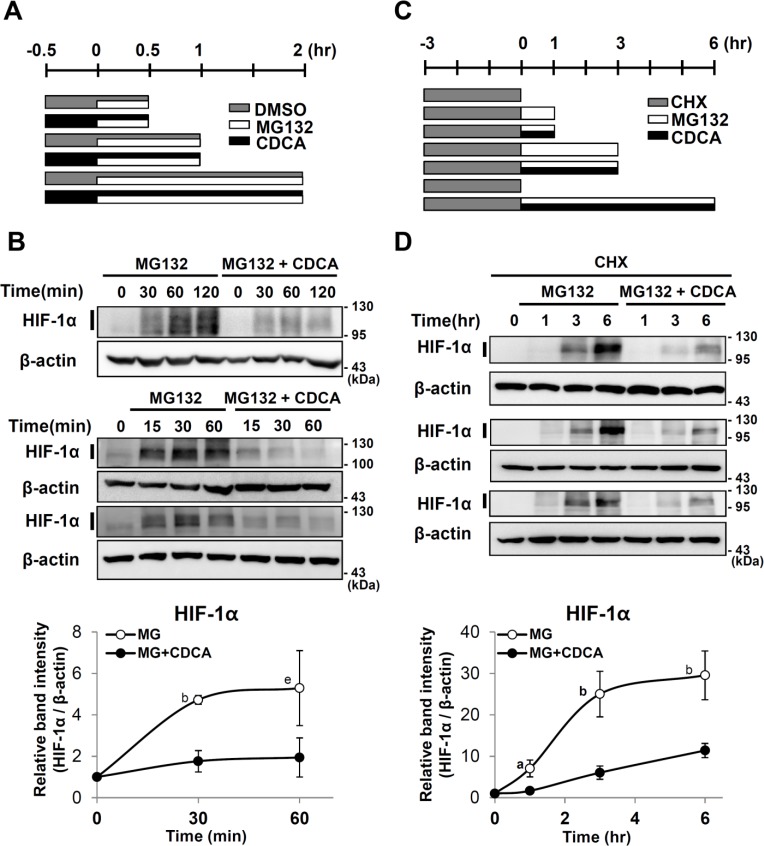
Fig 5. Effect of CDCA on de novo synthesis of HIF-1α protein.
(A) Experimental scheme. After serum starvation for 20 hr, HepG2 cells were pretreated with DMSO or CDCA (100μM), 30 min prior to MG132 (10 μM) treatment. (B) Western analyses of HIF-1α and β-actin proteins (three western blots are shown). (C) Experimental scheme. HepG2 cells were pretreated with CHX (10 μg/ml, 3 hr), then the culture media were replaced with fresh media containing MG132 (10 μM) and/or CDCA (100 μM) as indicated. (D) Western analyses of HIF-1α and β-actin proteins (three western blots are shown). Quantification of western analyses. The intensities of HIF-1α and β-actin bands marked with bars were measured using Image J software. The y-axis indicates the relative band intensities of HIF-1α protein to 0 hr. The band intensities of HIF-1α protein were normalized by β-actin protein. The x-axis indicates the hours for MG132 treatments. p values between band intensities of CDCA-treated and untreated samples are shown. a, p ≤ 0.1; b, p ≤ 0.05; c, p ≤ 0.01; d, p ≤ 0.001; e, p = 0.251.

