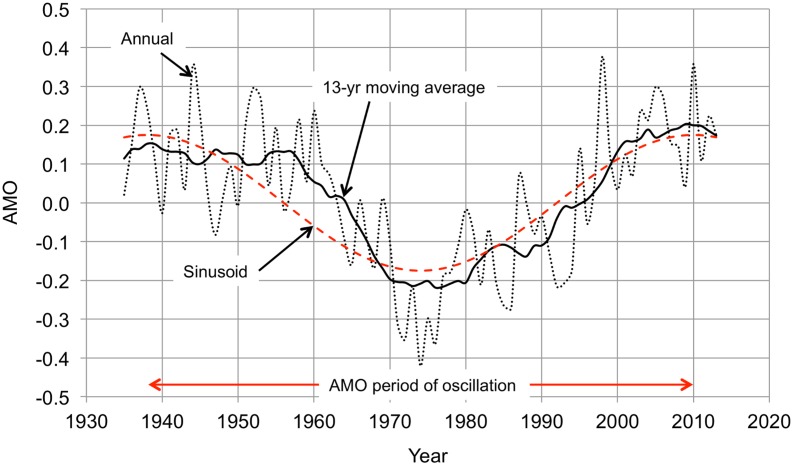
Fig 1. Atlantic multidecadal oscillation (AMO) 1935–2013.
The AMO is the difference between the North Atlantic sea surface temperature (SST) and its trend line (slope equal to 0.0026 K yr−1 for 1856–2013). The annual measurements (black dotted line) are smoothed with a 13-year centered moving average filter (black solid line). The sinusoid (red dashed line) is a least squares fit to the moving average. The data are from the NOAA Earth System Research Laboratory (ESRL) AMO website, http://www.esrl.noaa.gov/psd/gcos_wgsp/Timeseries/AMO/.

