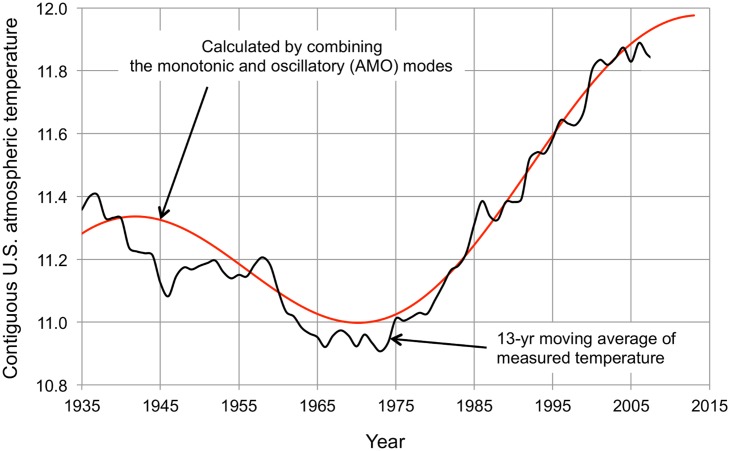
Fig 5. Measured and calculated contiguous U.S. temperature change.
The black solid line is the 13-year centered moving average atmospheric temperature (°C) from Fig 3 (truncated at 2007 because of the 13-year moving average). The red solid line is calculated by combining the monotonic and oscillatory (AMO) modes. The slope of the monotonic mode is 0.0089 K yr-1 and the amplitude of the oscillatory mode (AMO) is 0.75 K. The correlation between the measured and calculated curves is 0.98.

