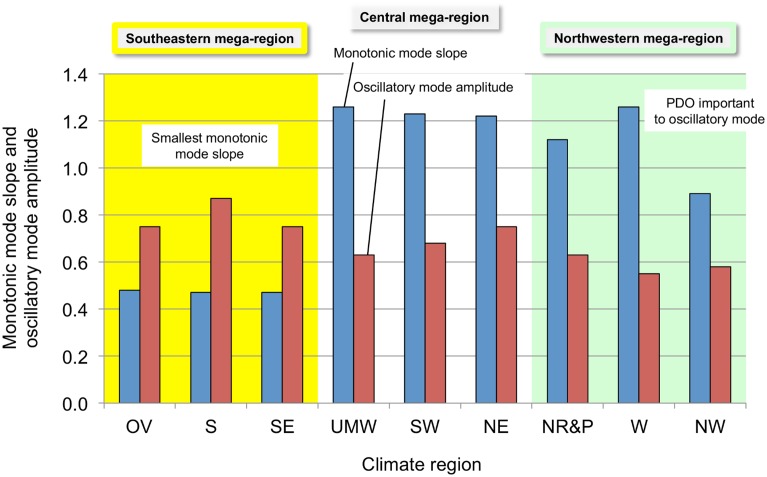
Fig 6. Monotonic mode slopes and oscillatory mode amplitudes.
The slope of the monotonic mode (K yr-1×10²) is taken from the trend line of each temperature time series and the oscillatory mode peak-to-peak amplitude (K) is that required to maximize the correlation of the temperature time series with the calculated curve of temperature vs. time. The climate mega-regions are shown by the colors.

