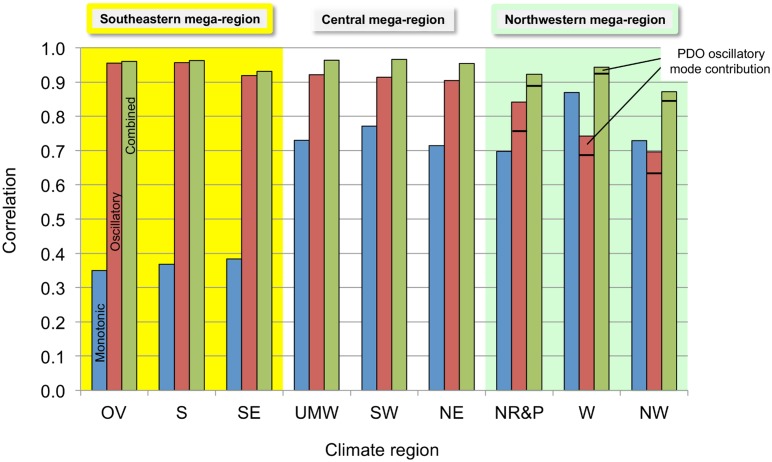
Fig 7. Correlations of the regional temperature time series with monotonic, oscillatory, and combined modes.
This bar chart shows the correlations of temperature time series for individual climate regions with the monotonic, oscillatory, and combined modes. The climate mega-regions are shown by the colors.

