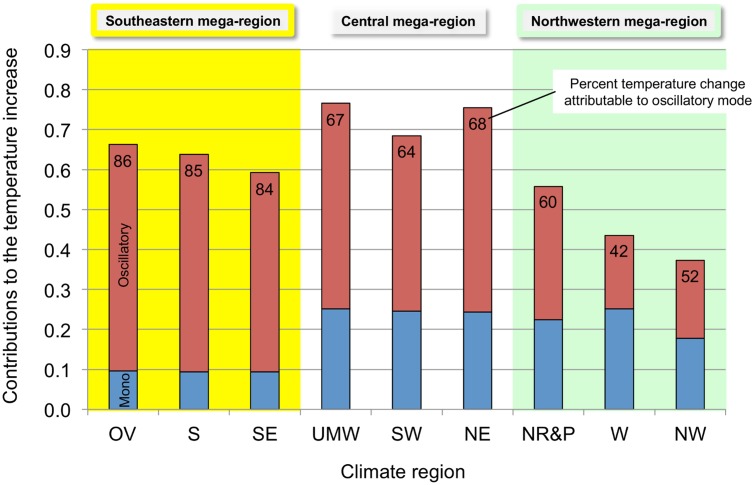
Fig 8. Contributions of the monotonic and oscillatory modes to the 1980–2000 contiguous U.S. regional temperature increases.
The stacked bars show the contributions (K) of the monotonic and oscillatory modes for each climate region. The inset numbers are the percent of the total temperature increase attributable to the oscillatory mode. The climate mega-regions are shown by the colors.

