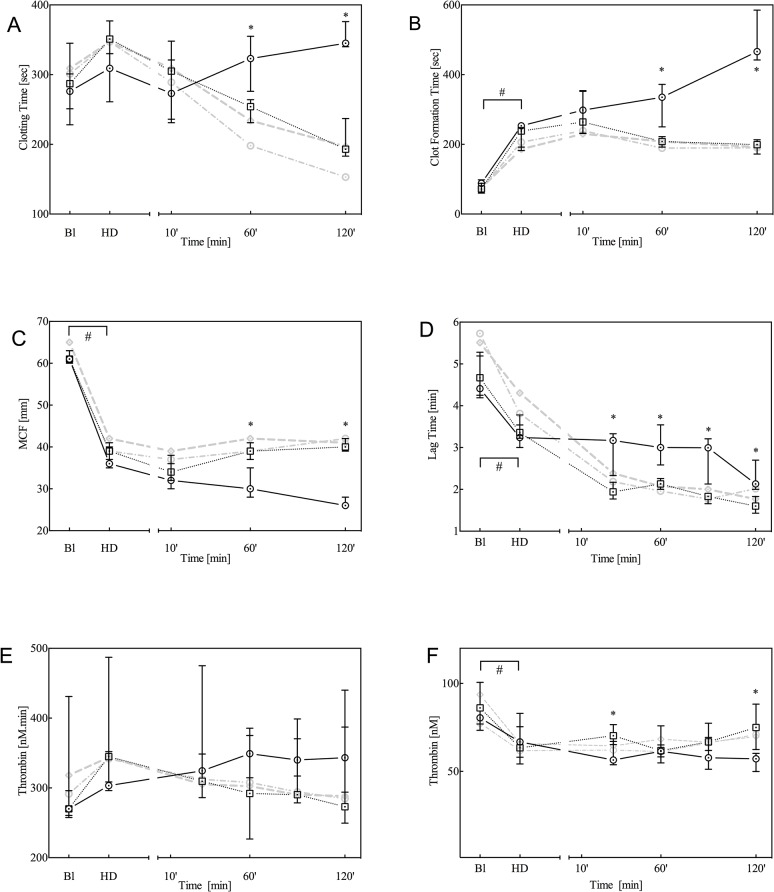
Fig 3. Thromboelastometry (TEM) analysis by means of ExTem (A, B and C) and plasma thrombin generation analysis (D, E, F; triggered by 0.25 pM TF) at baseline (Bl), after haemodilution (HD) and 10, 60 and 120 minutes after trauma.
For TEM, the parameters clotting time (CT: A), clot formation time (CFT: B) and maximum clot firmness (MCF: C) are given, whereas for thrombin generation the lag time (D), endogenous thrombin potential (ETP; E) and peak height (F) are given. Data are presented as the median with inter-quartile ranges (IQR) for controls (solid black line, n = 7) and animals treated with 90 μg/kg rFVIIa (dotted black line, n = 7). For comparison, data from animals treated with either 180 or 360 μg/kg rFVIIa are presented as grey dotted lines. *P<0.05 control versus rFVIIa; #P<0.05 over time between baseline and haemodilution.

