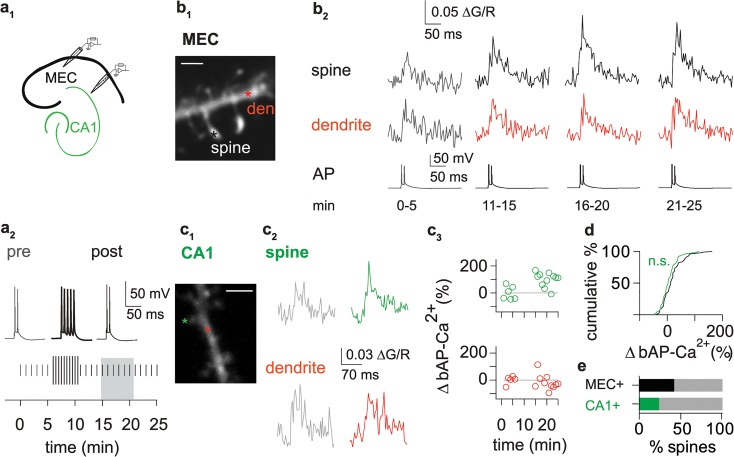
Fig 2. Enhancement of bAP-Ca2+ transients in dendritic spines.
(a1) Illustration of recording pipette positioning in layer 2 of the MEC (black) and in the hippocampal CA1 region (green). (a2) Experimental paradigm for enhancement of bAP-Ca2+ transients. Top: Test stimulus AP doublets evoked by current injection before (pre, grey) and after (post, black) 5 AP bursts (bold black). Bottom: Experimental timeline, vertical bars correspond to test stimulus AP doublet (short bars) and 5 APs (long bars). Doublet test stimuli were delivered every 60 s. After a 6 min baseline measurement, we applied a bursting paradigm consisting of 5 APs delivered every 30 s for 5 min. After the bursting paradigm, we again measured the bAP-Ca2+ transient evoked by the doublet test stimulus. Grey box illustrates the interval 15 to 20 min after bAP stimulation onset which is compared to baseline stimulation to quantify enhancement. (b1) Z-projection of the imaged dendritic segment (scale bar corresponds to 2 μm). Asterisks mark imaged spine and dendritic segment. (b2) bAP Ca2+ transient enhancement in a cortical neuron. Averaged fluorescence traces of Ca2+ transients in spine (top) and dendrite (middle). Representative AP traces from the time intervals averaged for Ca2+ imaging (bottom). (c1) Z-projection of the imaged dendritic segment in a hippocampal CA1 pyramidal cell. (scale bar corresponds to 2 μm). Asterisks mark imaged spine and dendritic segment. (c2) Overlay of averaged fluorescence traces 0–5 (grey) and 15–20 min after bAP stimulation onset in a CA1 pyramidal cell spine (green) and the adjacent dendrite (red). (c3) Time plot of normalized single sweep amplitudes. (d) Cumulative distribution plot of normalized bAP Ca2+ transient enhancement in spines of MEC layer 2 cortical neurons (19 ± 4%, n = 92/43 spines/cells, black) and hippocampal CA1 pyramidal cells (8 ± 4%, n = 59/22 spines/cells, green), comparison did not reach significance (n.s., Mann Whitney U Test). (e) Bar graph illustrates percentage of spines displaying bAP-Ca2+ transient enhancement >20% in MEC layer 2 cells (42%, 39/27 out of 92/43 spines/cells, black) and in hippocampal CA1 pyramidal cells (24%, 14/8 out of 59/22 measured spines/cells, green).

