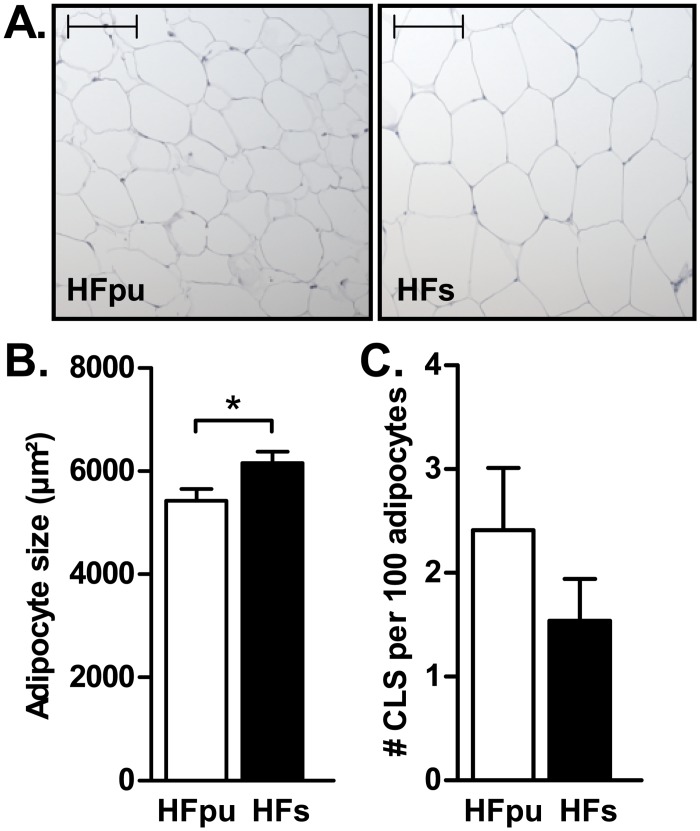
Fig 2. Mean adipocyte size and prevalence of crown-like structures in eWAT after 27 weeks of HF feeding.
Representative images (A) of the haematoxylin stainings that were used to determine the average adipocyte surface area (B) in eWAT of HFpu and HFs mice. The bar in each picture represents a distance of 100 μm. The number of CLS (C) was determined with a MAC-2 macrophage staining in eWAT. * P< 0.05 HFs mice vs. HFpu mice.

