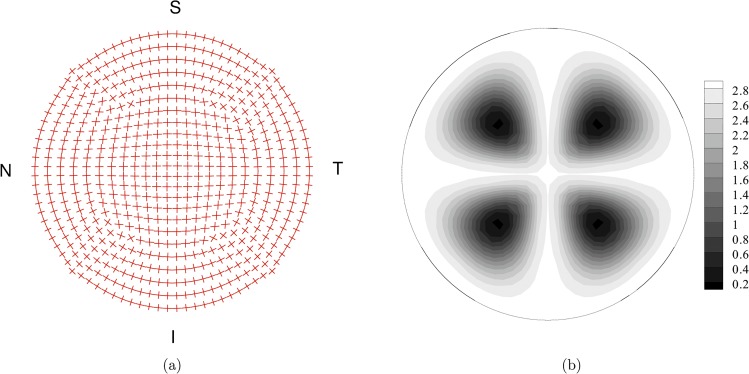
Fig 8. Fiber organization in the top layer of the finite element discretization of the cornea model.
(a) Mean orientation of the two sets of fibers. (b) Map of the von Mises coefficient b for the statistical distribution of the orientation. High values of b define highly oriented set of fibers. Low values of b define nearly isotropic orientations.

