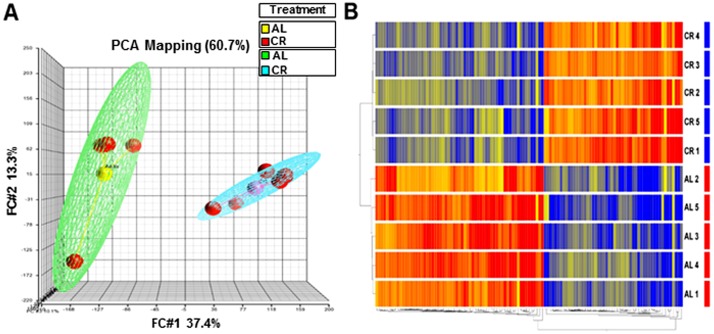
Fig 3. Short-term CR is associated with robust changes in LV gene expression profile.
Principal Component Analysis (PCA) depicting overall data. (A) PCA representation of replicates to visualize overall clustering of the microarray gene expression profiles of CR (blue mesh) and Ad lib (green mesh) containing 5 replicate samples (red) in each group. PCA depicts complete separation of overall pattern in CR vs. Ad lib (AL) samples, (B) The genes differentially expressed (upregulated or downregulated in the CR relative to AL) are clustered according to treatment group. The color gradient (red, up-regulation; green, down-regulation) represents normalized gene expression of each gene in all of the samples listed on the right side of each row. The dendrogram on the left shows the grouping of samples based on the similarity of gene expressions amongst them. Samples were clearly grouped according to CR treatment.

