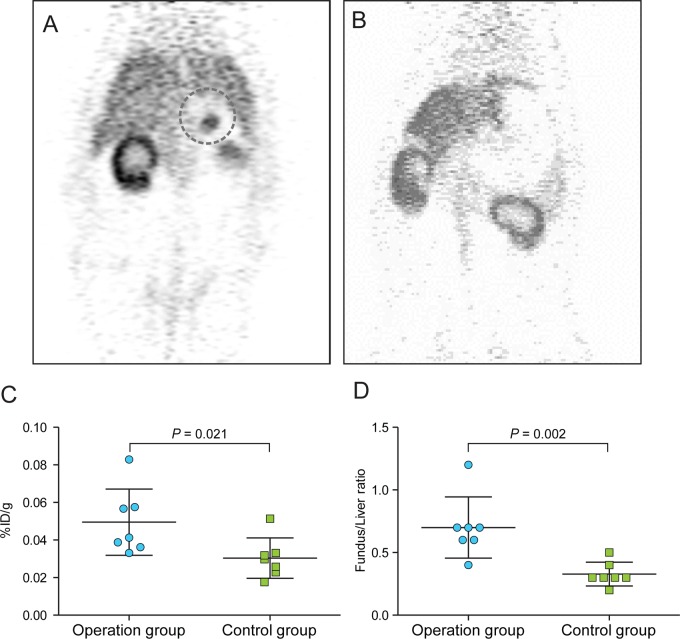
Fig 2. MicroPET imaging.
A. Operation group. 64Cu-ATSM uptake was observed in the fundus (dotted line). B. Control group. 64Cu-ATSM uptake was not observed in the fundus. C. Comparison of %ID/g values between the operation and control groups. D. Comparison of the fundus/liver ratio (%ID/g of fundus area by %ID/g of liver) between the operation and control groups.

