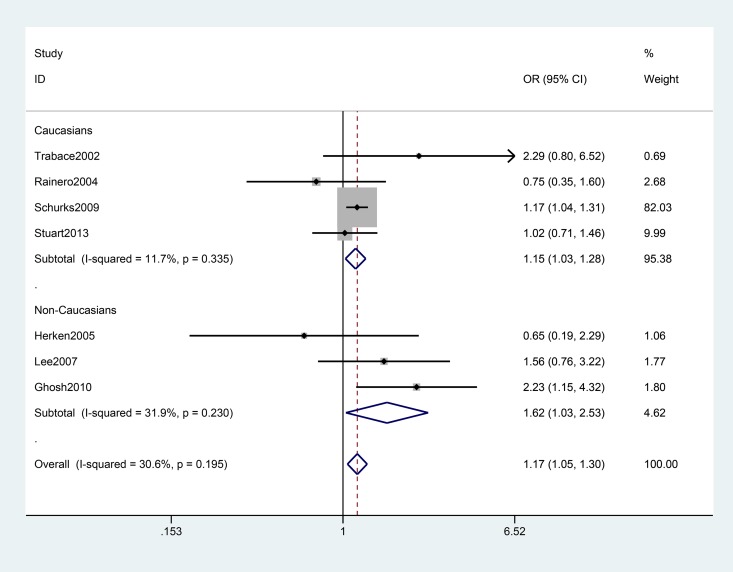
Fig 3. Forest plot of migraine with aura risk associated with the TNF –308G>A polymorphism stratified by ethnicity under the AA+GA vs. GG model.
The boxes and horizontal lines represent the OR and the corresponding 95% CI. The areas of the boxes indicate the weight (inverse of the variance). The diamonds correspond to the summary OR and 95% CI.

