
Figure 1.
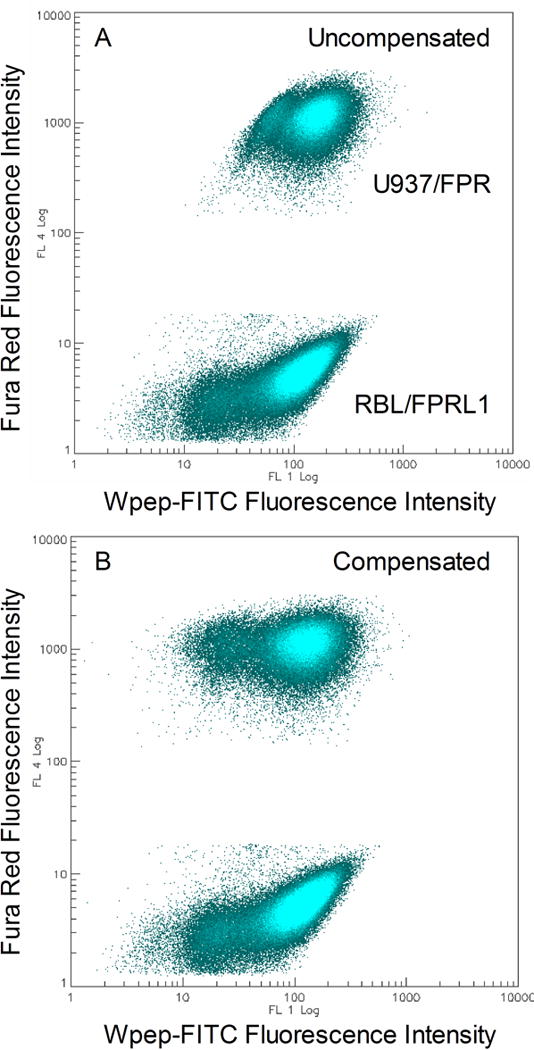
Fluorescence compensation to correct for red fluorescence spillover into the green fluorescence detection channel. A. Uncompensated fluorescence data. B. Fluorescence profile after compensation. Approximately 3% of the signal detected in the red FL4 channel for each event was subtracted from the corresponding signal detected in the green FL1 channel. The plots represent combined data from all 384 wells.