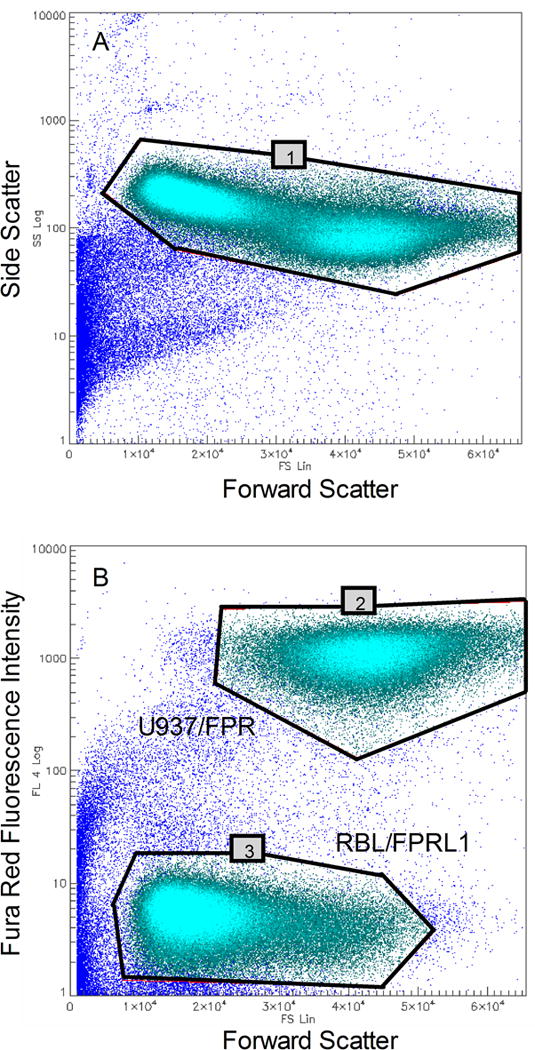
Figure 2.

Electronic gates required for analysis. A. A light scatter gate (gate 1) is constructed to exclude debris and non-viable cells from the analysis. B. Two additional gates are constructed on the basis of the color coding signals in the red fluorescence channel. One encloses red fluorescent U937/FPR cells (gate 2) and the other encloses unstained RBL/FPRL1 cells (gate 3). The plots represent combined data from all 384 wells.
