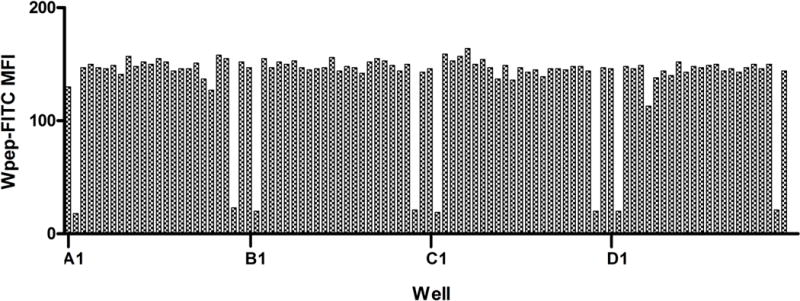
Figure 4.

Repetitive fluorescence intensity pattern provides supplementary sample indexing information. Illustrated are green fluorescence data from the first 96 wells of a 384-well plate. Wells are sampled from left-to right (columns 1 to 24) one row at a time, starting with the top row (row A) and moving down. This results in a repetitive pattern of low median fluorescence intensity (MFI) signals marking the 2nd and 23rd wells of each row, the locations of the positive control samples. This information facilitates identification of a row in which an indexing error has occurred.
