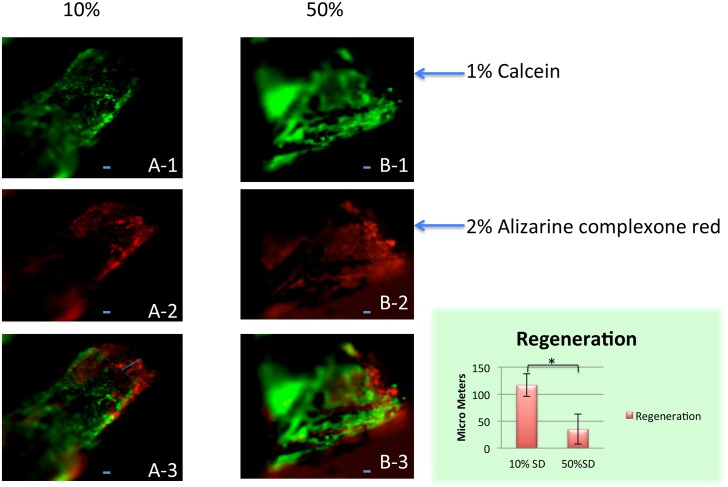
Fig 6. Use of two fluorochromes to measure bone regeneration in 10% and 50% segment defects after 3 weeks of regeneration.
1% calcein was injected on the day of surgery at a dose of 15ug/mg body weight. 2% alizarine complexone red was injected 1 week post-surgery at a dose of 30ug/mg body weight. Scale bar = 50 μM. Samples (six for each group) were harvested 3 weeks post-surgery. (A-1, A-2, A-3) is a 10% defect; (B-1,B-2,B-3) is a 50% defect. (A-1, B-1), calcein green fluorescence; (A2, B2), alizarine complexone red fluorescence; (A-3, B-3), red and green color merged. In the merged image of the 10% defect (A-3), the red color extends beyond the green, indicating that regeneration is taking place. By contrast, red and green show no separation in the merged image of the 50% defect (B-3), indicating lack of regeneration. The extent of regeneration was obtained by measuring the length of red extending beyond green on the anterior, middle and posterior points of the anterior-posterior axis of the fibula and averaging the three measurements (bar graph). The difference between the 10% and 20% defects was significant at p = 0.05 (Unpaired T-test). Scale bar = 50 μm.

