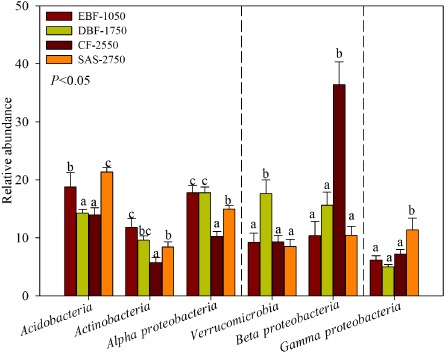
Fig 3.

Relative abundance of the dominant bacterial phyla in soil separated according to study sites. All data are presented as mean± SE. Different letters indicated statistical differences at a P value of < 0.05 among sampling sites by ONE ANOVA.

Relative abundance of the dominant bacterial phyla in soil separated according to study sites. All data are presented as mean± SE. Different letters indicated statistical differences at a P value of < 0.05 among sampling sites by ONE ANOVA.