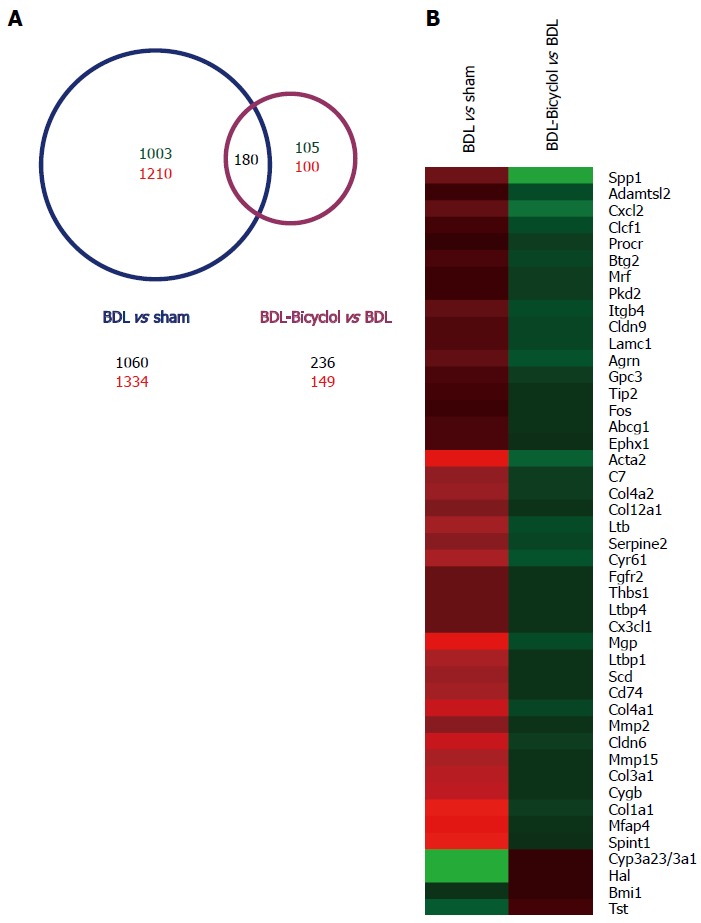
Figure 3.

Microarray analysis of rat liver tissues. Total RNA was isolated from the liver tissues, then each group of total RNA was mixed with the same amount of total RNA from each animal, then labeled with Cy3/Cy5 and measured by microarray assay. Red: increase in gene expression; green: decrease in gene expression; A: Number of genes significant changed in microarray assays; B: 45 fibrogenesis related genes reversed by bicyclol treatment.
