
Figure 4.
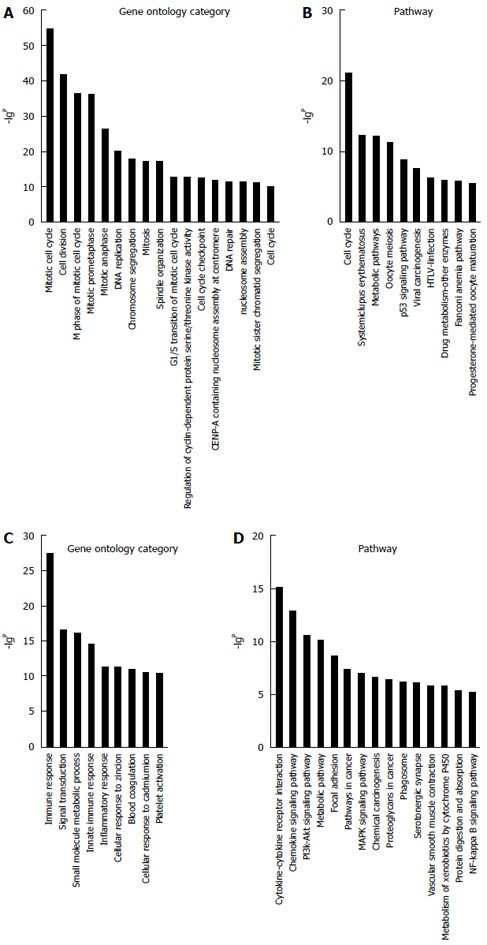
Gene ontology and pathway analyses. A total of 1270 differentially expressed mRNAs were chosen with a fold change > 3; the column graphs represent the enrichment of these mRNAs. The (-lgP) value is a positive correlation with gene ontology (GO) (A); Signaling pathway enrichment for upregulated mRNAs (B); GO (C); Signaling pathway enrichment for downregulated mRNAs (D). The (-lgP) values above five are presented.