Figure 1.

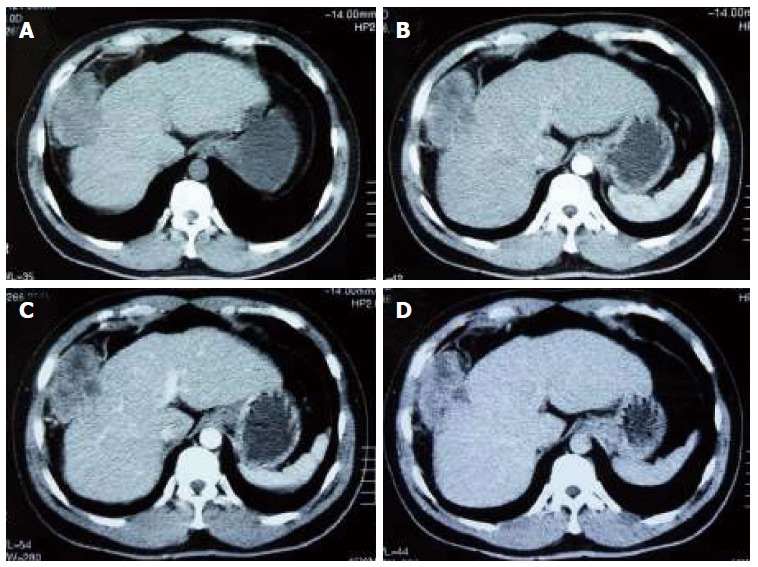
Contrast-enhanced computed tomography showing a 5 cm × 7 cm mass in segments V-VIII of the liver. A: Baseline scan; B: Arterial phase; C: Portal venous phase; D: Delayed phase.

Contrast-enhanced computed tomography showing a 5 cm × 7 cm mass in segments V-VIII of the liver. A: Baseline scan; B: Arterial phase; C: Portal venous phase; D: Delayed phase.