
Figure 4.
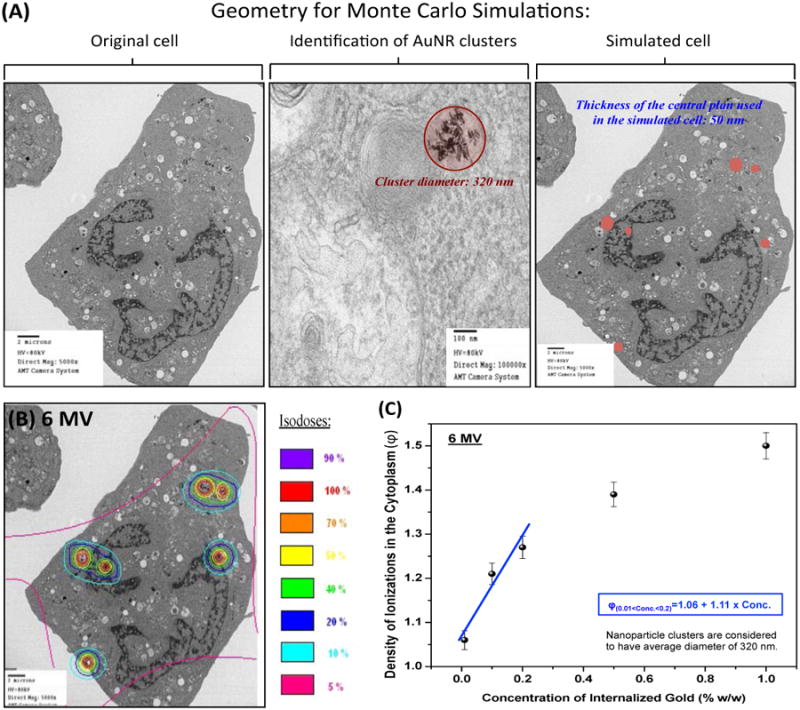
Monte Carlo simulation of gold nanoparticles internalized in a single cell: (A) Virtual geometry, including clusters, obtained from transmission electron microscopy image of a cell incubated with goserelin-conjugated gold nanoparticles (gAuNPs) for 24 h. (B) Isodoses formed by secondary electrons in the cytoplasm; Color scale indicates the normalized dose clouds around nanoparticle clusters. (C) Ratio of density of ionizations (Φ) in the cytoplasm of a cell with or without nanoparticles as a function of total gold concentration taken up by the cell.