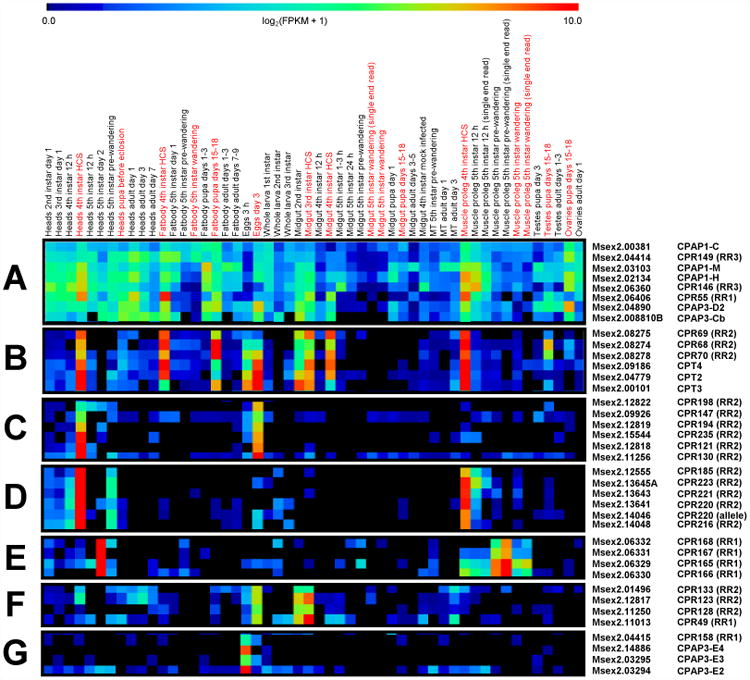
Figure 3. Selected expression patterns from cluster analysis.

The expression pattern of each CP gene across all 52 RNAseq libraries were grouped by cluster analysis as described in section 2.3. A – G highlight some of the unique expression patterns observed; a full heat map of all of the genes is shown in supplemental Figure S3. Red type indicates libraries prepared from pre-molt (pharate) stages.
