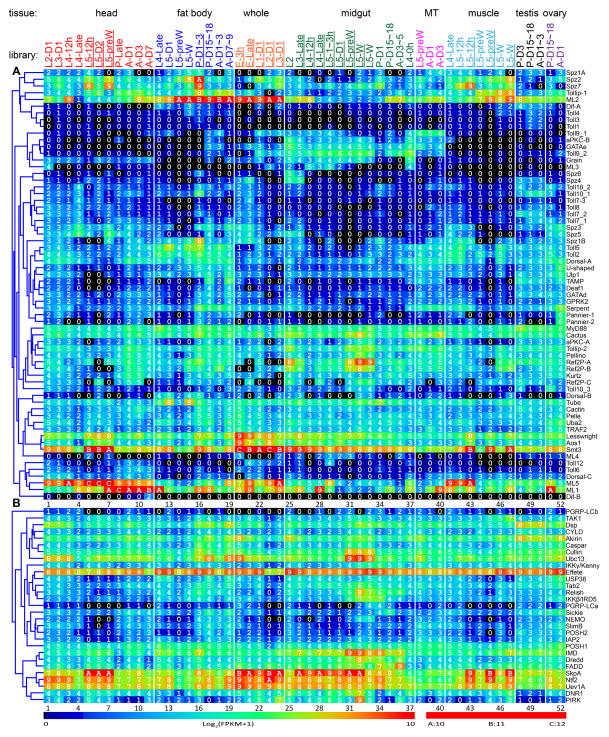
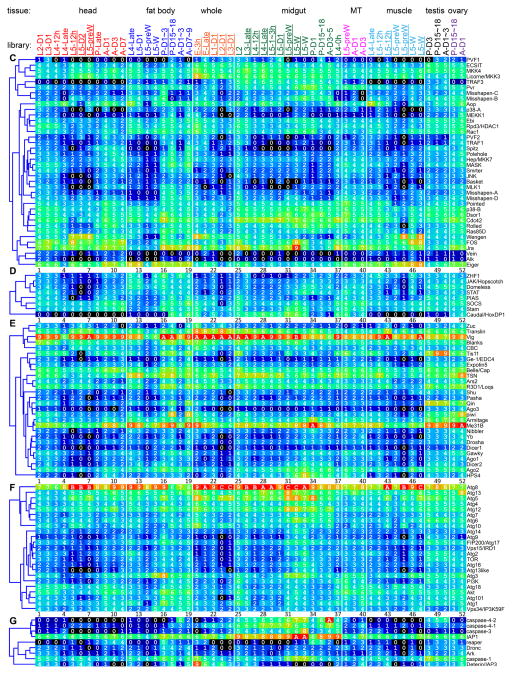
Fig. 2.
Transcript profiles of the putative signaling protein genes in the 52 tissue samples. The mRNA levels, as represented by log2(FPKM+1) values, are shown in the gradient heat map from blue (0) to red (≥10). The values of 0–0.49, 0.50–1.49, 1.50–2.49 ··· 8.50–9.49, 9.50–10.49 10.50–11.49, and 11.50–12.49 are labeled 0, 1, 2 … 9, A, B and C, respectively. The cDNA libraries are constructed from the following tissues and stages: head [2nd (instar) L (larvae), d1 (day 1); 3rd L, d1; 4th L, d0.5; 4th L, late; 5th L, d0.5; 5th L, d2; 5th L, pre-W (pre-wandering); P (pupae), late; A (adults), d1; A, d3; A, d7], fat body (4th L, late; 5th L, d1; 5th L, pre-W; 5th L, W; P, d1-3; P, d15-18; A, d1-3; A, d7-9), whole animals [E (embryos), 3h; E, late; 1st L; 2nd L; 3rd L), midgut (2nd L; 3rd L; 4th L, 12h; 4th L, late; 5th L, 1–3h; 5th L, 24h; 5th L, pre-W; 5th L, W; P, d1; P, d15-18; A, d3-5; 4th L, 0h), Malpighian tubules (MT) (5th L, pre-W; A, d1; A, d3), muscle (4th L, late; 5th L, 12h; 5th L, pre-W; 5th L, W), testis (P, d3; P, d15-18; A, d1-3), and ovary (P, d15-18; A, d1). Some libraries (underlined) are from single-end sequencing; the others are from paired-end sequencing. Note that some synonymous libraries exhibit different FPKMs due to method differences. Panel A, Toll; B, Imd with JNK branch; C, MAPK-JNK-p38; D, JAK-STAT; E, pi- si- and mi-RNA pathways, F, autophagy; G, apoptosis.


