
Figure 2.
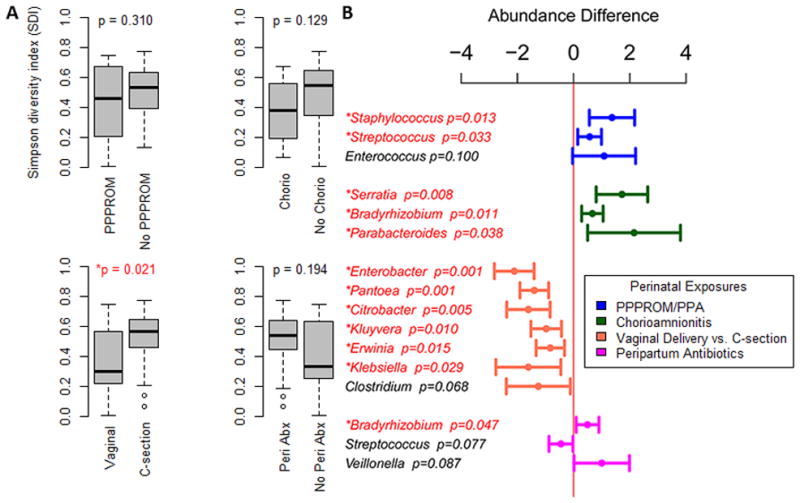
A) Microbial diversity relative to perinatal exposures. X axis depicts box plots of diversity based upon perinatal exposures. PPPROM (prolonged premature preterm rupture of membranes); Chorio (chorioamnionitis); Caesarean section; Peri Abx (Perinatal antibiotics). Y axis depicts Simpson Diversity Index (SDI) 0–1, 0=no diversity, 1=infinite diversity. B) Microbial abundance differences across all time points seen in subjects with and without a perinatal exposure. Microbial genera were evaluated for differences in abundance between groups of subjects with and without exposure to a specific peripartum exposure. A bar to the left of the midline represents a relatively lower abundance of the microbes, and a bar to the right of the midline represents a relatively greater abundance.