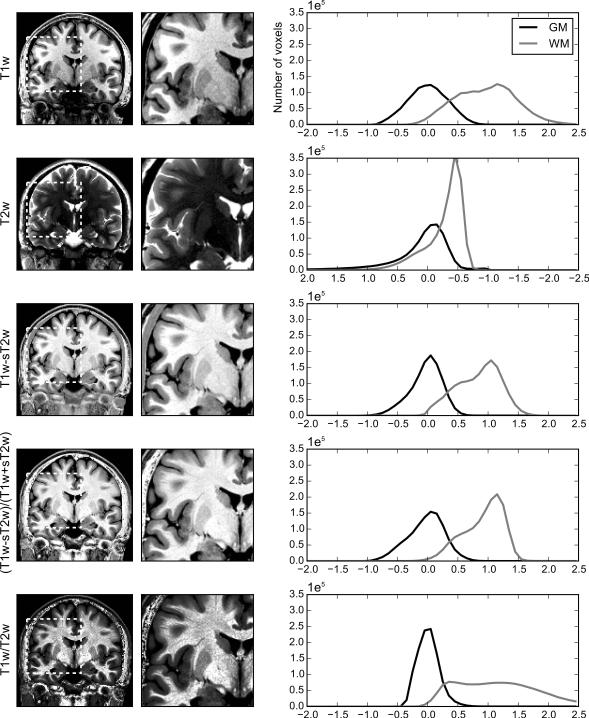
Figure 1.
One coronal slice of T1w, T2w, T1w-sT2w, CI ((T1w-sT2w)/(T1w+sT2w)), and T1w/T2w images for one representative subject (left column). The right images are zoomed regions of the left images marked with the white dotted square. For each image contrast, brain voxels within 5% to 95% of signal intensity distribution were mapped onto the display scale (0-255). The right column shows distribution plots of normalized intensity values for gray matter (GM) and white matter (WM) voxels from the whole brain. Voxels within 5% to 95% of signal intensity distribution for the whole brain were mapped onto −1.5 to 1.5 range with centering the median of GM voxels to be zero. The direction of horizontal axis of T2w distribution plot was reversed for comparing with other image types.

