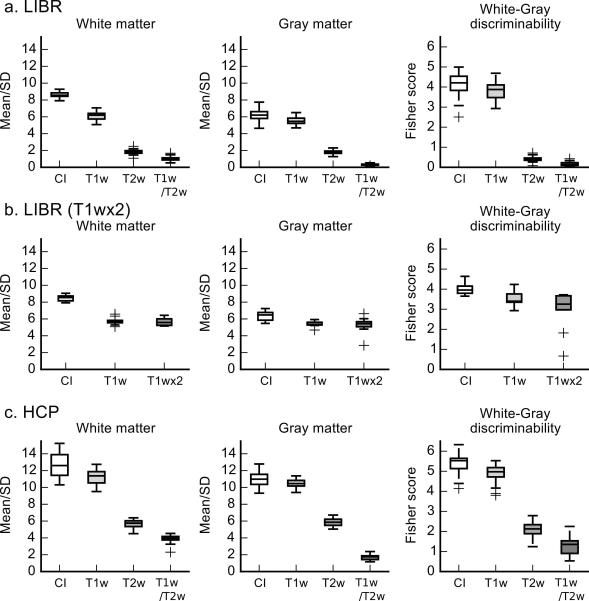
Figure 2.
Box plots of homogeneity (mean/SD) and discriminability (Fisher score, FS) of white and gray matter for the CI, T1w, T2w, and T1w/T2w of the LIBR data (a), LIBR data for T1wx2, and HCP data (c). The box indicates the range between the first and third quartiles, and the horizontal line in the box is the median. The vertical lines from the box indicate the range of all values within the 1.5 × interquartile range (IQR) from the edge of the box. Plus signs show the samples out of 1.5 × IQR.

