
Figure 3.
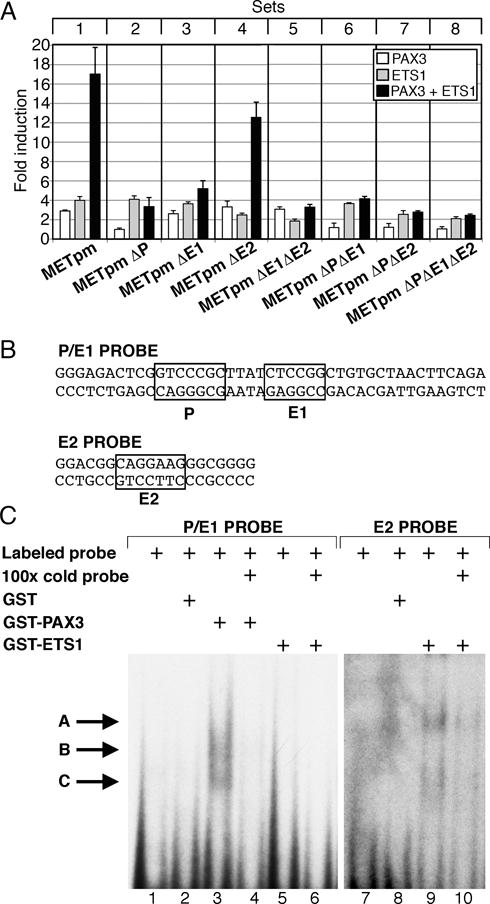
PAX3 and ETS1 activate the proximal MET promoter. (A) MET promoter reporter constructs, shown schematically in Figure 2, were transfected into 293T cells with PAX3 (white bars), ETS1 (grey bars), or both (black bars). Each bar represents n=9, with standard error of the mean as shown. Differences between synergistic activation of set 1 and the other sets are significant (p<0.05 set 4, p<0.005 other sets). (B) P/E1 and E2 probe sequences utilized in EMSA analysis. (C) PAX3 and ETS1 bind to elements within the MET promoter. Two EMSA probes were utilized, containing either the P and E1 sites (lanes 1–6) or the E2 site (lanes 7–10). Lanes contain either probe alone (lanes 1,7), with the addition of GST (lanes 2,8), PAX3 (lanes 3,4), or ETS1 (lanes 5,6,9,10) proteins. Cold probe was added in 100 times excess as a specific competitor (lanes 4, 6,10). Slower migrating bands are seen with the addition of PAX3 (lane 3, arrows B, C) or ETS1 (lane 9, arrows A, C).