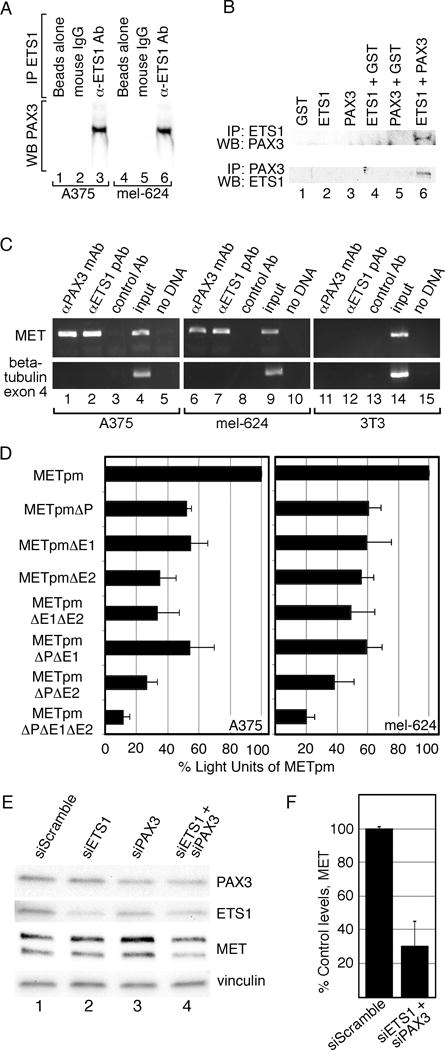
Figure 4.

PAX3 and ETS1 activate MET in melanoma cells. (A) PAX3 and ETS1 interact in melanoma cells. A375 and mel-624 cell lysates were immunoprecipitated without (lanes 1,2,4,5) or with ETS1 antibodies (lanes 3,6). Immunoprecipitants were probed by western analysis for the presence of PAX3. (B) PAX3 and ETS1 directly interact. Recombinant proteins were immunoprecipitated ETS1 antibody then probed for PAX3 expression (top row) or immunoprecipitated with PAX3 antibody then probed for ETS1 expression (bottom row). (C) PAX3 is located on the endogenous MET promoter in A375 and mel-624 cells. Chromatin immunoprecipitation (ChIP) analysis was performed with primers specific for the MET promoter (top gels) or exon 4 of the beta tubulin gene (bottom gels, negative control) in A375 (lanes 1–5), mel-624 (lanes 6–10), and 3T3 (11–15, negative control) cell lysates. Antibodies utilized for immunoprecipitations were against PAX3 (lane 1,6,11), ETS1 (lane 2,7,12), or normal mouse IgG (negative control, lane 3,8,13). Input DNA (positive control, lane 4,9,14) and water-blank without template DNA (negative control, lane 5,10,15) acted as PCR controls. Input DNA was collected for each sample after cell sonication but before immunoprecipitation. (D) PAX and ETS sites are active in A375 and mel-624 melanoma cells. MET promoter reporter constructs, shown schematically in Figure 2, were transfected into cells with the wild-type MET promoter sequence, or with the P, E1 and/or E2 sites mutated. Percent light units was calculated by dividing the light units generated from each set by the light units of the wild-type MET promoter, then multiplying by 100. Each bar represents n=9, with standard error of the mean as shown. Differences between wild-type METpm and all of the tested mutant constructs were significant for both cell lines, p<0.005. (E, F) Inhibition of PAX3 and ETS1 expression in mel-624 cells leads to a reduction of MET levels. Cells were transfected with scrambled control siRNA (lane 1) PAX3 or ETS1 gene specific siRNA alone (lanes 2,3), or together (lane 4). Graphs shown in F are quantified densitometry readings of MET bands from western analysis from E, (n=3). All densitometry readings were normalized against vinculin loading controls. MET expression was reduced significantly (p<0.02) to 30%±14.7% in PAX3 and ETS1 siRNA transfected cells compared to siScramble.
