
Figure 5.
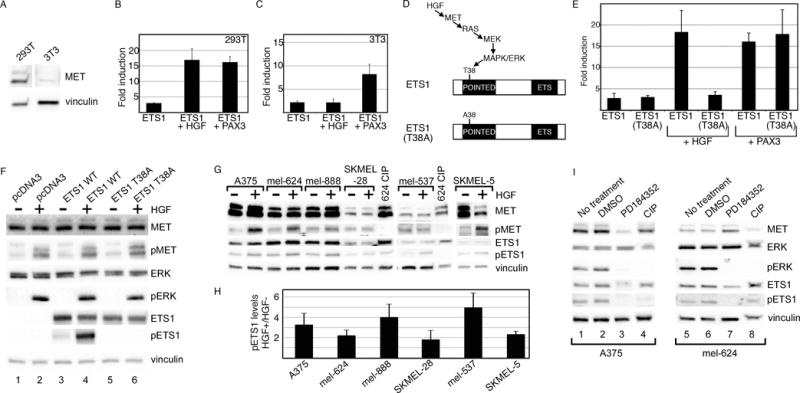
ETS1 synergistically activates MET with PAX3 or HGF. (A) MET is expressed in 293T cells but not in 3T3 cells. Western analysis for MET and vinculin (loading control) in 293T and 3T3 cells. (B, C) ETS1 and PAX3 activate MET synergistically in 293T and 3T3 cells, while a synergistic effect of ETS1 and HGF is only seen in 293T cells. Luciferase assays of 293T (B) and 3T3 (C) cells transfected with the wild-type METpm (shown schematically in Figure 2B) and ETS1, with the addition of PAX3 or exogenous HGF. Increased levels of luciferase were significant for all samples in comparison to vector alone (293T: p<0.005, 3T3: p<0.05), and between ETS1 + HGF in 293T cells and ETS1 + PAX3 in both cell lines in comparison to ETS1 alone (p<0.05). The levels of luciferase did not increase significantly in 3T3 cells with the addition of HGF and ETS1 in comparison to ETS1 alone (p=0.475). (D) Schematic of the HGF/MET/MAPK phosphorylation site on epitope T38 of ETS1. In the ETS1(T38A) mutant protein, a mutation of T38 to an alanine abrogates the ability of MAPK to phosphorylate ETS1 (22–25). (E) The ETS1(T38A) mutant synergistically activates MET expression with PAX3 but not with HGF. Luciferase assays of 293T cells transfected with either ETS1 or ETS1(T38A), with or without the addition of HGF or PAX3. Each bar represents n=9, with standard error of the mean as shown. The addition of HGF or PAX3 to ETS1, or HGF to ETS1(T38A) transfected cells led to a significant fold increase in luciferase versus ETS1 proteins alone (p<0.005). Conversely, HGF was unable to increase overall luciferase levels in comparison to ETS1(T38A) alone (p=0.172). (F) Mutation of ETS1(T38A) abrogates ETS1 phosphorylation after HGF treatment. 293T cells transfected with empty vector (pcDNA3), ETS1 wild-type, and ETS1(T38A) expression constructs are grown in the absence (−) or presence (+) of exogenous HGF. Western blots were probed with antibodies against MET, phosphorylated MET (pMET), ERK, pERK, ETS1, and pETS1. Vinculin antibody was included as a loading control. (G, H) HGF increases the levels of pETS1 in 5/6 melanoma cell lines. Protein lysates from cells without (−) or with (+) the addition of HGF treatment were tested for the expression of MET, pMET, ETS1, pETS1 and vinculin. Lysate from mel-624 treated with calf-intestinal phosphatase (CIP) was a negative control for phosphorylated proteins. Band intensity for pETS1 was measured by densitometry for three independent experiments (shown graphically in H). Levels for pETS1 post HGF treatment, in comparison to untreated cells, increased significantly (p<0.05) in all cell lines except for SKMEL-28 (p=0.218). (I) Treatment with a MEK-specific inhibitor, PD184352, decreases pETS1 levels. Protein lysates from A375 and mel-624 cells untreated, mock treated (DMSO), or treated with PD1184352 were tested for the expression of MET, ERK, pERK, ETS1, pETS1, and vinculin. Lysates treated with CIP served as a negative control for phosphorylated proteins. All Western analyses shown are representatives of three independent experiments.