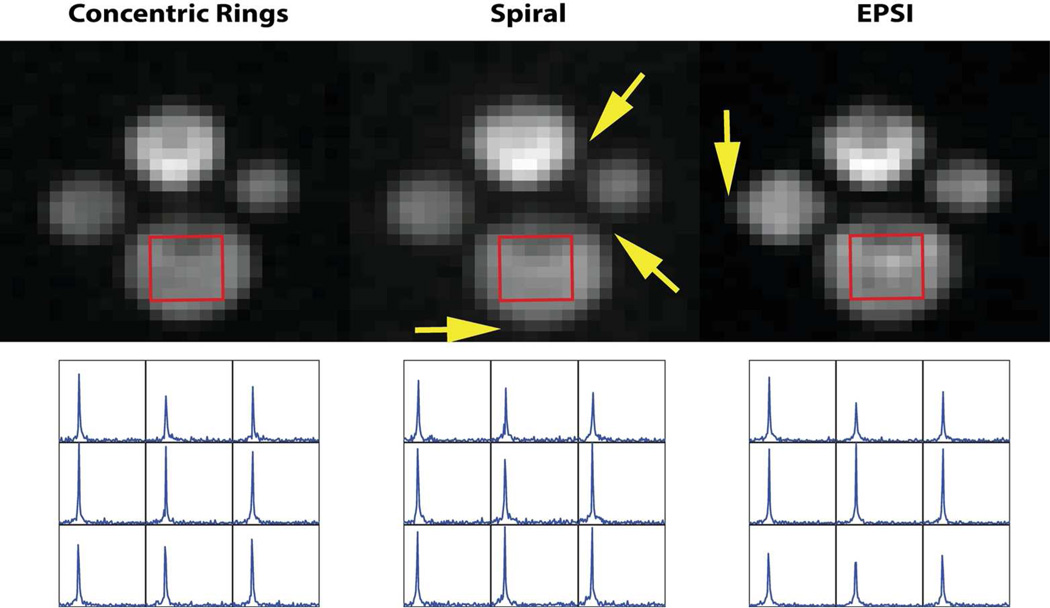
Figure 5.
Comparison of 13C phantom spectroscopic imaging using CRT, Spiral and EPSI: the top row (from left to right) images were obtained from CRT, Spiral and EPSI respectively. They were created from spectroscopic images via projection along the spectral domain. The displayed 13C 2D image has a nominal spatial resolution of 1.83×1.83 mm2 after zero padding and was cropped into a 5×5 cm2 ROI. The arrows show the slight blurring of spiral and EPSI. The bottom row (from left to right) plots are of 13C bicarbonate spectra obtained from CRT, Spiral and EPSI, respectively, from the same 9 voxels.

