
Fig. 4.
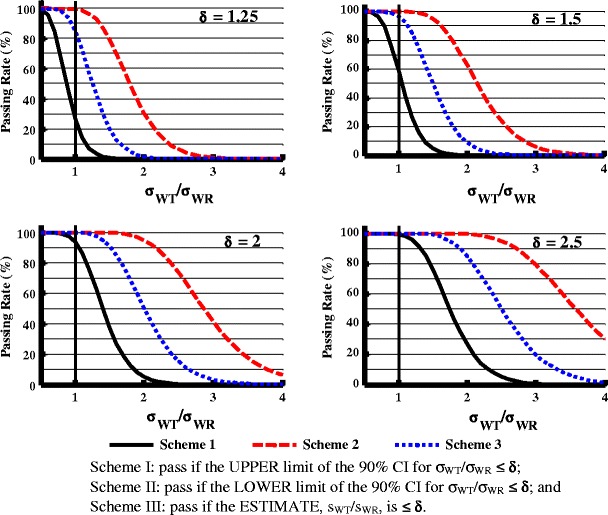
Effect of variability comparison evaluation schemes (I, II, and III) and the regulatory standard (δ) on the study power (σ WR = 0.1), n = 24. Scheme I pass if the UPPER limit of the 90% CI for σ WT/σ WR ≤ δ, Scheme II pass if the LOWER limit of the 90% CI for σ WT/σ WR ≤ δ, and Scheme III pass if the ESTIMATE, sWT/sWR, is ≤δ