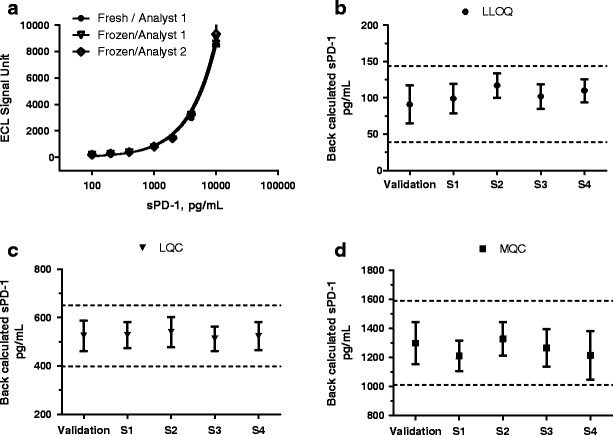
Fig. 5.

a–d Assay performance using fresh or frozen standards during validation and clinical studies. a Standard curves generated by two different analysts using freshly prepared standards (n = 2) or pre-prepared standards (n = 4) which were kept frozen at −80°C until use. Results are shown as mean ± standard error of mean. b–d In-study QC sample performance (using frozen standards). Back-calculated LLOQ, LQC, and MQC data were collected from assay validation and four clinical sample analyses (S1–S4) over a 3-month period. Results are shown as mean and SD, (n = 38–76). The dotted lines in the graph depict mean ± 2SD values for each QC
