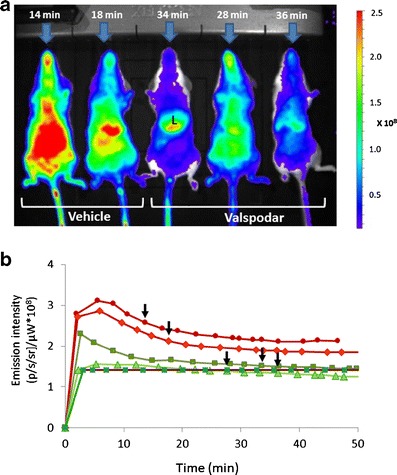
Fig. 2.

Whole body images of mice treated with indocyanine green in the presence and the absence of valspodar. a A representative image showing five female mice treated with indocyanine green (ICG; 8 mg/kg, i.v.). Forty-five minutes before ICG injection, mice were treated i.p. with valspodar (12.5 mg/kg, i.p.) or the vehicle. Shown is the time elapsed (min) between ICG injection and image acquisition for each mouse. Also indicated is the liver (L). b Concentration-time curves of liver emission intensity. Visual inspection of the image may lead to bias due to the different time intervals between injection and image acquisition for each mouse (indicated by arrows). The time intervals result from the need to inject the probe and induce anesthesia before placement in the dark chamber
