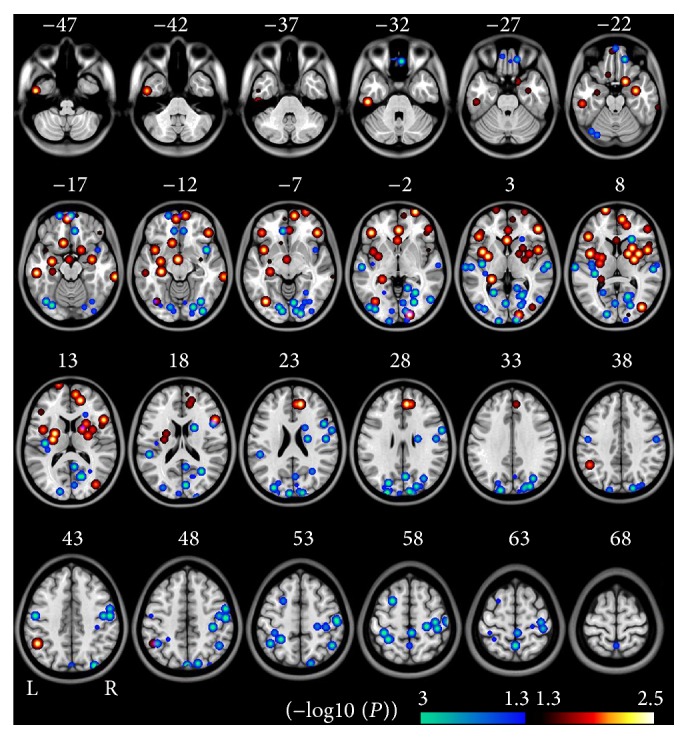
Figure 1.

Brain regions with significant differences in ALFF/fALFF in meta-analysis between schizophrenia and healthy controls (P < 0.05, uncorrected, cluster size >540 mm3). The hot color represents the higher ALFF/fALFF in schizophrenia patients. The cold color represents the higher ALFF/fALFF in healthy controls. The overlapping area is marked in the pink color. Here, it represents the contradictory results between studies. The (−log10 (P)) value means the negative ten-logarithm transformation of P value. A larger value of (−log10 (P))represents a smaller P value.
