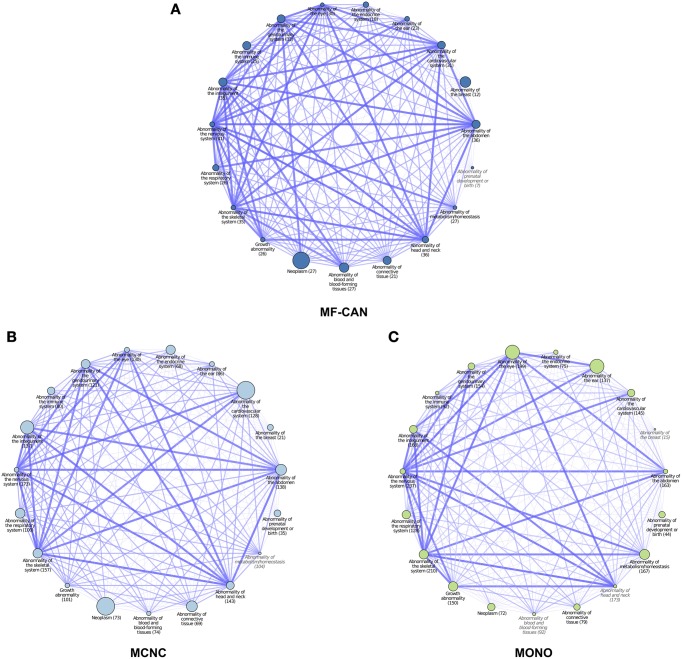
Figure 3.
Network representation of Human Phenotype Ontology (HPO) classes associated with MF-CAN (A), MCNC (B), and MONO (C) proteins. Each node corresponds to a HPO broad phenotype class (organ abnormalities branch), the size of the nodes is proportional to the over-representation of proteins of the three categories among the proteins annotated to the node's phenotype. Nodes whose name is in gray and italic had no significant overrepresentation (p ≥ 0.05). The numbers in parentheses are the number of proteins of each category found annotated to each HPO class. Edges between nodes indicate proteins that are annotated to both HPO classes. The width and different color shade of the edge is proportional to the number of proteins shared by both HPO classes.

