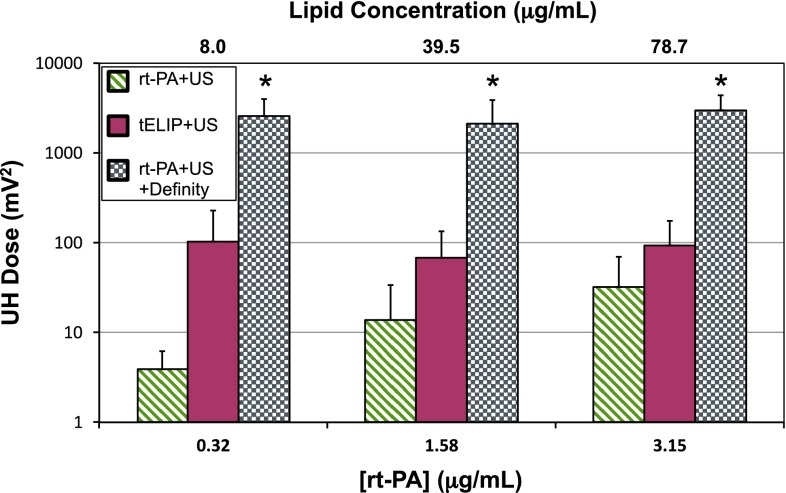
Fig. 4.
The ultraharmonic dose, defined as the summation of ultraharmonic emissions over the 30 min treatment duration, shown for all cohorts employing 120-kHz insonation at all concentrations of rt-PA. The asterisk (*) indicates the treatment arm is significantly greater (p < 0.05) than all other treatment arms for a given concentration of rt-PA. The lipid concentration of t-ELIP is indicated on the top abscissa. The sample size for each treatment (n) is 12

