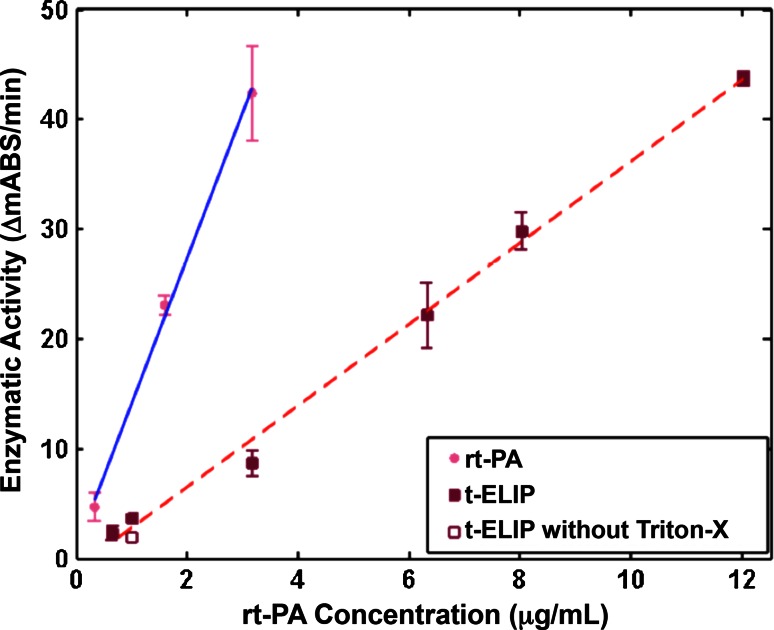
Fig. 5.
Enzymatic activity of rt-PA released from t-ELIP (solid squares) and rt-PA (solid circles). The solid, blue line is the linear fit of activity for rt-PA as a function of rt-PA concentration, and the dashed, red line is the linear fit of activity for t-ELIP as a function of rt-PA concentration. For reference, the activity of t-ELIP without the addition of Triton-X in the spectrophotometric assay is shown 1 μg/mL rt-PA (open square), and is approximately 59 % of that when Triton-X is used

