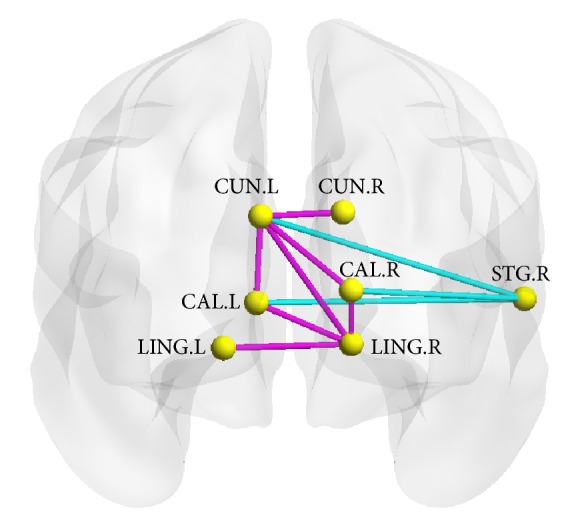
Figure 3.

The region pairs showing altered nodal centralities brain regions and functional connections in the PMNE patients. These connections formed a single connected network with 7 nodes and 10 connections, which was significantly (P < 0.05, corrected) abnormal in the patients. Edge in cyan: increased functional connections in the PMNE patients; edge in magenta: decreased functional connections in the PMNE patients. CUN, cuneus; LING, lingual gyrus; CAL, calcarine sulcus; STG, superior temporal gyrus; R, right hemisphere; P, posterior. The nodes and connections were mapped onto the cortical surfaces using the BrainNet Viewer package (http://www.nitrc.org/projects/bnv).
