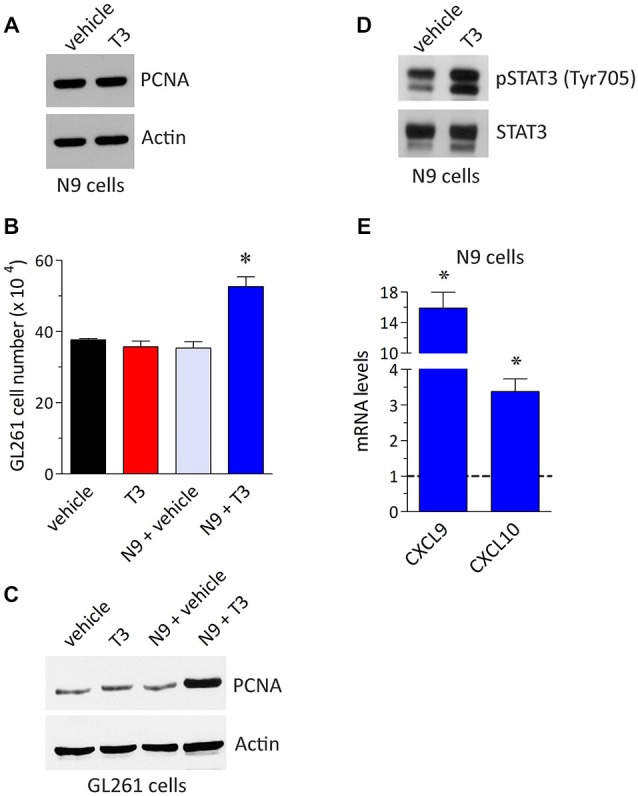
Figure 1.

T3 induces glioma cell growth by a direct action on microglia. (A) Expression of the proliferation marker proliferating cell nuclear antigen (PCNA) in N9 cells plated in the absence and in the presence of T3 (1 μM, 24 h). The Western blot analysis was performed as described previously (Armani et al., 2007; Cervia et al., 2007, 2013; Bizzozero et al., 2014; Cazzato et al., 2014; De Palma et al., 2014; Perrotta et al., 2014) using the mouse monoclonal anti-PCNA (PC-10) and the goat polyclonal anti-actin (I-19) (internal standard) primary antibodies (Santa Cruz Biotechnology, Dallas, TX, USA). The image is representative of results obtained from three different experiments (n = 3). (B) GL261 cell number in co-culture experiments. The experimental setting was in agreement with a previous report (Zhai et al., 2011), with minor corrections. Briefly, GL261 cells were seeded in the bottom wells of Costar transwell plates (24-mm diameter insert, 0.4 μM pore size, polycarbonate membrane; Corning Life Sciences, Corning, NY, USA) with or without N9 cells in the top wells (1:1 N9:GL261), both in the absence or in the presence of T3 (1 μM). Cell concentration after 24 h cultures was measured by counting trypan blue-excluding cells with TC20 Automated Cell Counter (Bio-Rad, Hercules, CA, USA), as described previously (Cervia et al., 2013; Perrotta et al., 2014). Each histogram represents the data obtained from 3–6 different experiments (n = 3–6). The results were expressed as means ± SEM. *P < 0.001 vs. the other values, using one-way ANOVA followed by the Tukey’s multiple comparison post-test (GraphPad Prism; GraphPad Software, La Jolla, CA, USA). (C) Western blot analysis of PCNA in GL261 cells co-cultured as described above. The image is representative of results obtained from three different experiments (n = 3). (D) STAT3 phosphorylation in N9 cells plated in the absence and in the presence of T3 (1 μM, 24 h). The Western blot analysis was performed using the rabbit polyclonal anti-phospho STAT3 (Tyr705) and the anti-STAT3 primary antibodies (Cell Signaling Technology, Danvers, MA, USA). The image is representative of results obtained from three different experiments (n = 3). (E) Real-time quantitative PCR experiments of mRNA levels for CXCL9 and CXCL10 in N9 cells in the presence of T3 (1 μM, 24 h). Experiments were performed as previously detailed (Cervia et al., 2008, 2012, 2013; Charles et al., 2012; Bizzozero et al., 2014; Cazzato et al., 2014; De Palma et al., 2014; Perrotta et al., 2014). Primer pairs: CXCL9, 5′-TCCTTTTGGGCATCATCTTCC-3′ (forward) and 5′-TTTGTAGTGGATCGTGCCTCG-3′ (reverse); CXCL10 5′-TCCTTGTCCTCCCTAGCTCA-3′ (forward) and 5′-ATAACCCCTTGGGAAGATGG-3′ (reverse) (Primmbiotech, Milano, Italy). Values are expressed as the fold change over control (untreated N9 cells). Each histogram represents the data obtained from three different experiments (n = 3) run in triplicate. The results were expressed as means ± SEM. P < 0.05 vs. respective control (one-way ANOVA followed by the Tukey’s multiple comparison post-test).
