FIGURE 1.
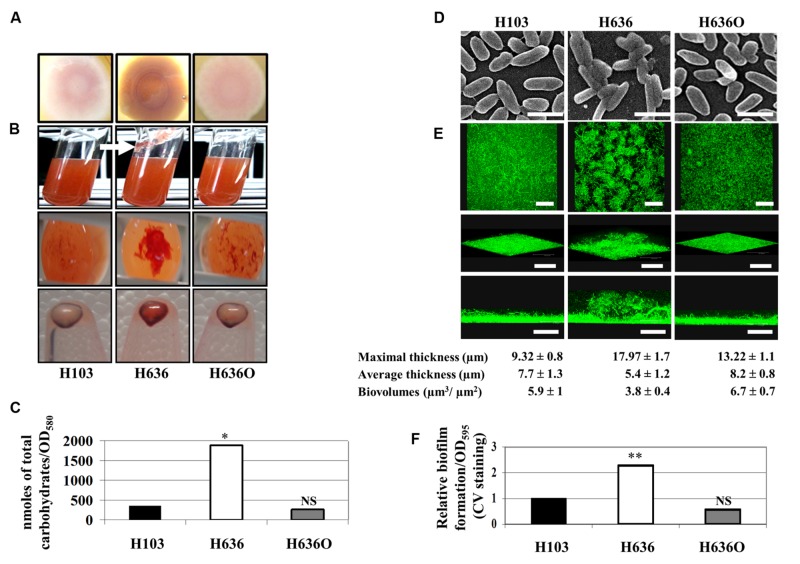
The absence of OprF led to increase EPS production and biofilm formation in P. aeruginosa. (A) Colony morphology observed on Congo red (CR) containing LB agar plates. (B) H103, H636, and H636O were grown in CR containing LB for 24 h at 37°C. Top images: a slime production is indicated by a white arrow in case of H636; middle images: CR colored aggregates were observed at the bottom of the cultures; bottom images: CR binding of pelleted cells (109). (C) Cell-associated carbohydrates were quantified by gas chromatography. Statistics were achieved by unpaired t-test. ∗p < 0.05, NS, not significant. (D) Scanning electron microscopy images of H103, H636, and H636O allowed to attach onto a glass coverslip for 2 h (enlargement: 4,500 x; scales represent 2 μm). (E) Biofilms of H103, H636, and H636O grown in flow cells for 24 h and examined by CLSM. Top images, top views (x, y-plane; scales represent 48 μm); intermediate images, cross section views (scales represent 67 μm); bottom images, 3D-modelizations (x, y, z-axes, scales represent 48 μm). Maximal (μm), average thicknesses (μm), and biovolumes (μm3/μm2) were determined by COMSTAT analyses. The averages and standard deviations were calculated from 10 samples. (F) Microtiter grown biofilm formed by H103, H636, and H636O. Biofilms were quantified by measuring absorbance at 595 nm after crystal violet (CV) staining. At least six assays were performed for each strain. Statistics were achieved by unpaired t-test. ∗∗p < 0.01, NS, not significant.

