
Figure 2.
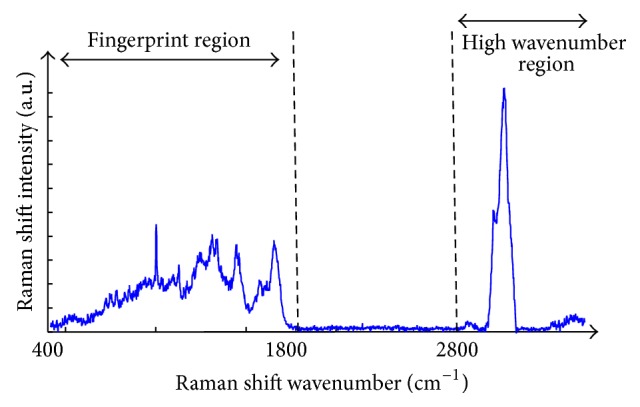
Raman spectrum of cervical cancer CaSki cell line. The variation of Raman shift wavelength is expressed in wavenumbers (cm−1) and can be observed along the X-axis whilst the intensity is represented along the Y-axis. The fingerprint and the high wavenumber (HW) regions of the spectrum are indicated by the arrows.