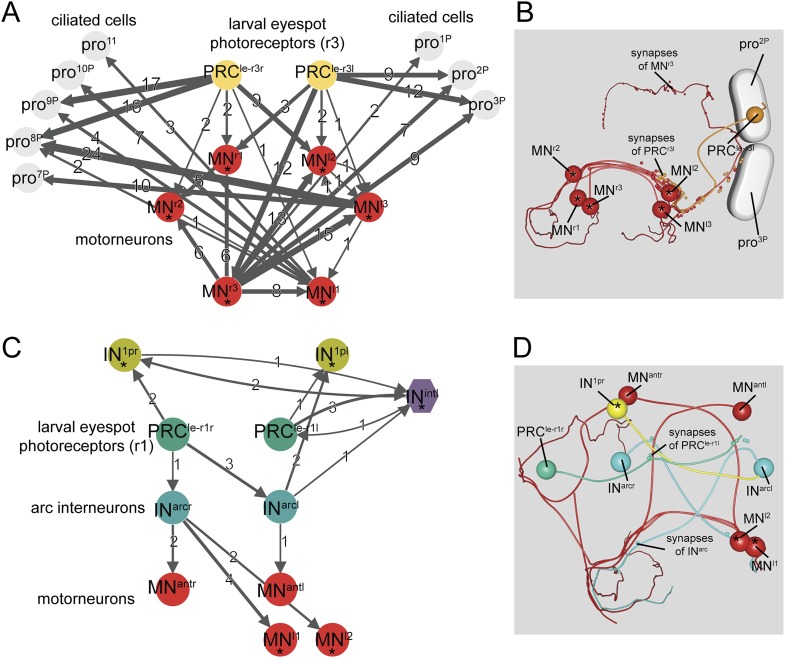
Figure 4. Minimal eye circuit of the larval eye.
Neurons that are also part of the visual eye circuit are marked by an ‘asterisk’. Connectivity graph of the r-opsin3-expressing PRCr3 (A) and r-opsin1-expressing PRCr1 (C). Connectivity graph edges are weighted by the number of synapses and synapse numbers are shown. Blender visualization of the left PRCr3l cell (B) and PRCr1r circuitry (D). Abbreviations are shown in Figure 1.

