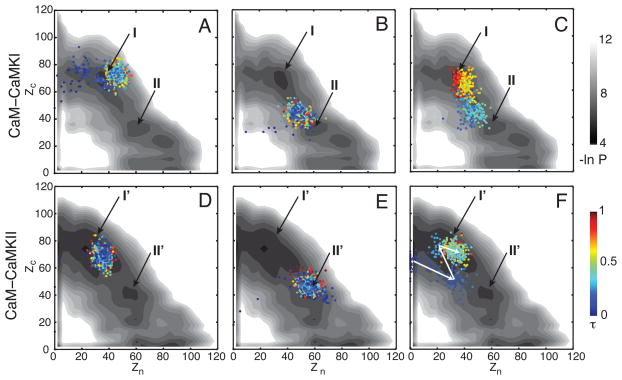
Figure 2.
Interactions between the CaM domains and the CaMBTs during association. (A), (B) and (C) represent three successful trajectories for the association of CaM-CaMKI projected on the 2D distribution (in log-scale) –ln P(Zn, Zc) of all the trajectories. Similarly, (D), (E) and (F) are for CaM-CaMKII. The trajectories are colored by a normalized time from blue to red. The 2D distribution is colored from black to white proportional to the population (from high to low). See the Models and Method section for the definition of Zn and Zc. The basins (I and II in A–C for CaM-CaMKI, and I′ and II′ in D–F for CaM-CaMKII) are indicated by the black arrows.

