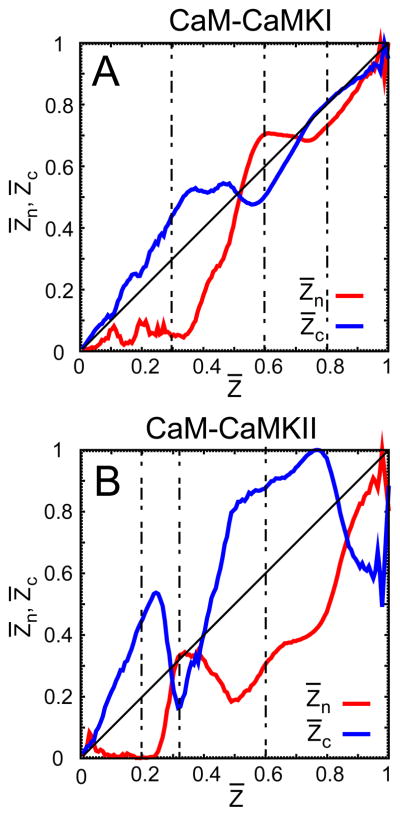
Figure 3.

The binding route analysis on the trajectories from the successful associations between CaM and the CaMBTs. (A) and (B) illustrate the formation of the normalized intermolecular contacts and from the N- and C-terminal domain of CaM compared to the average Z̄ (normalized) and the targets CaMKI and CaMKII, respectively. For both systems Z̄ is defined as the total number of intermolecular contacts between CaM and the target, such that . See the Models and Method section for a detailed discussion on Z̄, and . In each plot, the diagonal line is drawn as a reference for the intermolecular contacts or that ideally follow the average Z̄. The vertical dashed lines in the plots indicate the values of Z̄ for which the corresponding values of and differ significantly during the association for both systems.
