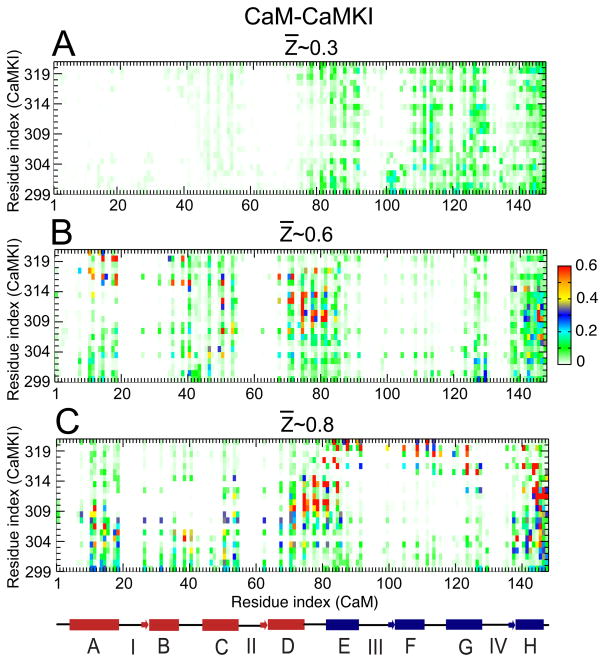
Figure 4.
Probability of contact formation between CaM and CaMKI along the binding route. (A), (B) and (C) represent the contact maps calculated between the amino acids from the side-chain of CaM and CaMKI, at the different values of Z̄ ~0.3, 0.6 and 0.8 (as indicated in Fig. 3 (A)), respectively. A linearized model of CaM is shown below the plots with the individual helices displayed as cylinders, the linkers connecting the helices shown as lines, and the N-terminal and C-terminal helices are shown in red and blue, respectively.

