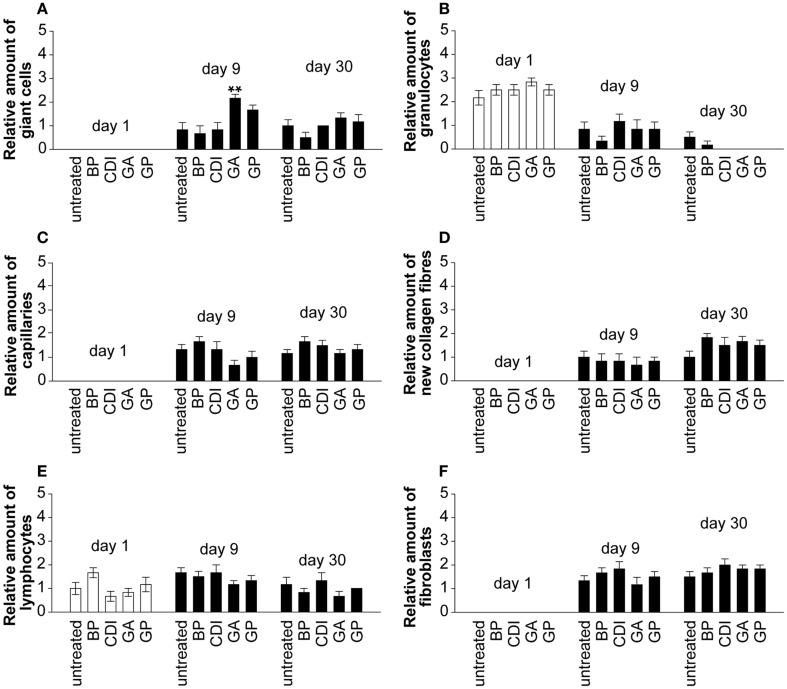
Figure 8.
Histological analysis of the degree of scaffold infiltration by giant cells (A), granulocytes (B), capillaries (C), collagen fibers (D), lymphocytes (E), and fibroblasts (F) at days 1, 9, and 30 post implantation. In all implants, an increase of infiltrating giant cells, lymphocytes, fibroblasts, capillaries, and collagen fibers could be detected over time. Furthermore, a decrease of infiltration by granulocytes could be observed in all implants at day 30 compared to day 1 post implantation. A blinded pathologist evaluated the presence of cells (granulocytes, lymphocytes, giant cells, and fibroblasts), capillaries and new collagen fibers and generated a semiquantitative score in repeat determination (0 = negative, 1 = mild, 2 = moderate, 3 = serve; n = 6/group and day; five microscopic fields per slide and rat; each 5 mm2). Untreated, untreated decellular ureteral tissue; BP, bovine pericardium (St. Jude, USA); GP, genipin; GA, glutaraldehyde; CDI, carbodiimide. **P < 0.01 vs. untreated decellular ureteral tissue.

